According to the survey conducted by KuRunData among 1,043 Chinese consumers, around 61.1 percent of respondents gathered information on beverages from e-commerce platforms via online shopping platforms. Approximately 23 percent of respondents learned about beverages on WeChat.
Most used channels to learn about beverages among respondents in China in 2020
Basic Account
Get to know the platform
You only have access to basic statistics.
This statistic is not included in your account.
Starter Account
The ideal entry-level account for individual users
- Instant access to 1m statistics
- Download in XLS, PDF & PNG format
- Detailed references
$199 USD / Month *
Professional Account
Full access
Business Solutions including all features.
* Prices do not include sales tax.
Other statistics that may interest you Non-alcoholic beverages in China
Market overview
5
- Premium Statistic Revenue of the non-alcoholic drinks market worldwide by country 2022
- Premium Statistic China: revenue of non-alcoholic drinks 2014-2027, by type
- Premium Statistic Non-alcoholic drink monthly production in China 2023-2024
- Premium Statistic Import value of non-alcoholic beverages APAC 2021, by country
- Premium Statistic Export value of non-alcoholic beverages APAC 2022, by country
Retail
5
- Premium Statistic Non-alcoholic beverage retail sales breakdown in China 2020, by type
- Premium Statistic Retail sales value of soft beverages in China 2020-2025, by type
- Premium Statistic Sales value of non-alcoholic drinks in China 2017-2027, by sales channel
- Premium Statistic Retail sales value of non-alcoholic beverages in China 2019-2024, by sales channel
- Premium Statistic Online sales value of major beverage brands on Alibaba platforms in China 2020
Major product types
5
- Premium Statistic Retail sales value of bottled water in China 2013-2020
- Premium Statistic Retail sales value of tea beverages in China 2019-2024, by type
- Premium Statistic Retail sales value of juice beverages in China 2019-2024, by type
- Premium Statistic China: revenue of the soft drink market 2014-2027, by type
- Premium Statistic Market size of energy drinks in China 2011-2020
Leading brands
5
- Premium Statistic Brand value of the most valuable soft drink brands worldwide 2023
- Premium Statistic Market share of non-alcoholic drinks in China 2019, by enterprise
- Premium Statistic Fastest-growing beverage brands in China 2022
- Premium Statistic Share of carbonated beverage market in China 2019, by company
- Premium Statistic Leading energy drinks brands in China 2020, based on offline sales share
Consumption
5
- Premium Statistic Leading type of drinks purchased by consumers in China in 2020
- Premium Statistic Major factors when choosing non-alcoholic beverages in China 2019, by gender
- Premium Statistic 
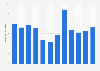
Leading channels to get information on beverages in China 2020
- Premium Statistic Most preferred locations to buy beverages in China 2020
- Premium Statistic Share of consumers who prefer sugar-free drinks in China 2020
Further related statistics
18
- Distribution of the beverage market in the Netherlands 2017, by type of beverage
- Soft drinks: market share of dilutables in the United Kingdom 2022, by flavor
- Soft drinks: energy drinks by regular, mid and no calorie in the United Kingdom 2015
- Beverage market in Mexico 2013, by type
- Per capita expenditure on beverages in Mexico 2020, by type
- U.S. beverage market volume growth in 2017, by beverage type
- Pepsi's market share of the carbonated beverages industry in India 2011-2016
- Pepsi's market share of the juice beverages industry in India 2011-2016
- Market share of Spendrups Bryggeri in Sweden 2017, by product category
- Frequency of consuming non-alcoholic beers Japan 2019, by gender
- Wine consumption per capita in the Netherlands 2008-2022
- Market share of selected soft drinks in Denmark 2016
- Volume market share of soft drink pub and club suppliers in the United Kingdom 2013
- Fever Tree: global adjusted EBITDA 2014-2022
- Market share of leading companies for naturally healthy beverages South Korea 2017
- Most popular fruit drinks flavors among Poles 2019
- Soft drinks consumption in Africa 2018, by country
- Reasons for most recent non-alcoholic beer consumption Japan 2019
Further Content: You might find this interesting as well
Statistics
- Distribution of the beverage market in the Netherlands 2017, by type of beverage
- Soft drinks: market share of dilutables in the United Kingdom 2022, by flavor
- Soft drinks: energy drinks by regular, mid and no calorie in the United Kingdom 2015
- Beverage market in Mexico 2013, by type
- Per capita expenditure on beverages in Mexico 2020, by type
- U.S. beverage market volume growth in 2017, by beverage type
- Pepsi's market share of the carbonated beverages industry in India 2011-2016
- Pepsi's market share of the juice beverages industry in India 2011-2016
- Market share of Spendrups Bryggeri in Sweden 2017, by product category
- Frequency of consuming non-alcoholic beers Japan 2019, by gender
- Wine consumption per capita in the Netherlands 2008-2022
- Market share of selected soft drinks in Denmark 2016
- Volume market share of soft drink pub and club suppliers in the United Kingdom 2013
- Fever Tree: global adjusted EBITDA 2014-2022
- Market share of leading companies for naturally healthy beverages South Korea 2017
- Most popular fruit drinks flavors among Poles 2019
- Soft drinks consumption in Africa 2018, by country
- Reasons for most recent non-alcoholic beer consumption Japan 2019
KuRunData. (January 14, 2021). Most used channels to learn about beverages among respondents in China in 2020 [Graph]. In Statista. Retrieved April 19, 2024, from https://www.statista.com/statistics/1197712/china-leading-channels-to-learn-about-beverages/
KuRunData. "Most used channels to learn about beverages among respondents in China in 2020." Chart. January 14, 2021. Statista. Accessed April 19, 2024. https://www.statista.com/statistics/1197712/china-leading-channels-to-learn-about-beverages/
KuRunData. (2021). Most used channels to learn about beverages among respondents in China in 2020. Statista. Statista Inc.. Accessed: April 19, 2024. https://www.statista.com/statistics/1197712/china-leading-channels-to-learn-about-beverages/
KuRunData. "Most Used Channels to Learn about Beverages among Respondents in China in 2020." Statista, Statista Inc., 14 Jan 2021, https://www.statista.com/statistics/1197712/china-leading-channels-to-learn-about-beverages/
KuRunData, Most used channels to learn about beverages among respondents in China in 2020 Statista, https://www.statista.com/statistics/1197712/china-leading-channels-to-learn-about-beverages/ (last visited April 19, 2024)
Most used channels to learn about beverages among respondents in China in 2020 [Graph], KuRunData, January 14, 2021. [Online]. Available: https://www.statista.com/statistics/1197712/china-leading-channels-to-learn-about-beverages/