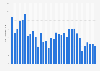
Millions of households across the United States tune in to watch NBA games every week during the season. Fans of the San Antonio Spurs seem to be particularly invested in their local team, with the household rating in the local TV market reaching 3.51 during the 2019/20 NBA season.
Average rating of selected National Basketball Association (NBA) local TV markets in the United States in 2019/20
Loading statistic...
Basic Account
Get to know the platform
You only have access to basic statistics.
Starter Account
The ideal entry-level account for individual users
- Instant access to 1m statistics
- Download in XLS, PDF & PNG format
- Detailed references
$199 USD / Month *
Professional Account
Full access
Business Solutions including all features.
* Prices do not include sales tax.
Other statistics that may interest you Statistics on
About the industry
10
- Premium Statistic WNBA Draft TV viewers 2023
- Premium Statistic Average player expenses of National Basketball Association teams 2001-2023
- Premium Statistic WNBA Finals TV viewership 2023
- Premium Statistic WNBA regular season TV viewers 2023
- Premium Statistic WNBA Finals wins by team 2023
- Basic Statistic NBA all-time scoring list 1946-2024
- Premium Statistic NBA Finals wins by team 2023
- Premium Statistic National Basketball Association salary cap 2012-2024
- Basic Statistic Teams of the NBA ranked by revenue 2022/23
- Basic Statistic Franchise value of the Toronto Raptors (NBA) 2003-2023
About the region
10
- Premium Statistic Share of Americans who follow the NBA in the U.S. 2021, by generation
- Premium Statistic Franchise value of the Memphis Grizzlies (NBA) 2003-2023
- Premium Statistic New York Knicks' revenue 2001-2023
- Basic Statistic Franchise value of the Portland Trail Blazers (NBA) 2003-2023
- Premium Statistic Franchise value of the Atlanta Hawks (NBA) 2003-2023
- Basic Statistic Franchise value of the Chicago Bulls (NBA) 2003-2023
- Basic Statistic Houston Rockets' revenue 2001-2023
- Basic Statistic Franchise value of the Miami Heat (NBA) 2003-2023
- Premium Statistic Oklahoma City Thunder's revenue 2001-2023
- Premium Statistic Average operating income of National Basketball Association teams 2001-2023
Selected statistics
1
Other regions
10
- Premium Statistic Companions of men's volleyball match spectators South Korea 2021
- Basic Statistic Toronto Raptors' revenue 2001-2023
- Basic Statistic WNBA Twitter followers as of 2023
- Premium Statistic Average franchise value in major U.S. sports leagues 2007-2022
- Premium Statistic Men's Lega Basket Serie A in Italy winners 1919-2021
- Basic Statistic Number of permits issued for professional sports Philippines CY 2021, by type
- Premium Statistic Breakdown of French women's basketball championship titles 1937-2019
- Premium Statistic CBA number of attendance 2014/15 - 2015/16
- Basic Statistic Prices for ads on TVP1 during UEFA transmissions in Poland 2020
- Basic Statistic Leading Belgian national team players at FIFA World Cup 2018, by market value
Related statistics
10
- Basic Statistic Franchise value of the New York Knicks (NBA) 2003-2023
- Basic Statistic Philadelphia 76ers' revenue 2001-2023
- Basic Statistic Operating income of the Chicago Bulls (NBA) 2001-2023
- Premium Statistic NBA regular season ticketing revenue as share of total revenue 2010-2023
- Premium Statistic Indiana Pacers' revenue 2001-2023
- Basic Statistic Franchise value of the Oklahoma City Thunder (NBA) 2003-2023
- Basic Statistic Phoenix Suns' revenue 2001-2023
- Premium Statistic Franchise value of the Golden State Warriors (NBA) 2003-2023
- Basic Statistic Los Angeles Clippers' revenue 2001-2023
- Premium Statistic Franchise value of the Orlando Magic (NBA) 2003-2023
Further related statistics
1
Further Content: You might find this interesting as well
SportsPro. (December 21, 2020). Average rating of selected National Basketball Association (NBA) local TV markets in the United States in 2019/20 [Graph]. In Statista. Retrieved April 18, 2024, from https://www.statista.com/statistics/1224572/nba-local-tv-ratings/
SportsPro. "Average rating of selected National Basketball Association (NBA) local TV markets in the United States in 2019/20." Chart. December 21, 2020. Statista. Accessed April 18, 2024. https://www.statista.com/statistics/1224572/nba-local-tv-ratings/
SportsPro. (2020). Average rating of selected National Basketball Association (NBA) local TV markets in the United States in 2019/20. Statista. Statista Inc.. Accessed: April 18, 2024. https://www.statista.com/statistics/1224572/nba-local-tv-ratings/
SportsPro. "Average Rating of Selected National Basketball Association (Nba) Local Tv Markets in The United States in 2019/20." Statista, Statista Inc., 21 Dec 2020, https://www.statista.com/statistics/1224572/nba-local-tv-ratings/
SportsPro, Average rating of selected National Basketball Association (NBA) local TV markets in the United States in 2019/20 Statista, https://www.statista.com/statistics/1224572/nba-local-tv-ratings/ (last visited April 18, 2024)
Average rating of selected National Basketball Association (NBA) local TV markets in the United States in 2019/20 [Graph], SportsPro, December 21, 2020. [Online]. Available: https://www.statista.com/statistics/1224572/nba-local-tv-ratings/