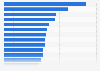
Population distribution by five-year age group and gender in China 2022
The age distribution of China's population by five-year age groups in 2022 demonstrates that there are more males than females in the population for all age groups below 60 to 64 years. The largest gender difference exists for the younger age groups born between 2000 and 2010 when the one-child policy had been enforced most strictly.