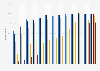
Average session length on food delivery apps worldwide 2019-2021, by region
According to a study, mobile users now spend significantly more time browsing and shopping for food via apps. In 2021, the average session in a food delivery app lasted about 17 minutes in North America, nearly three minutes longer than in 2019. A similar gap was observed in the Asia-Pacific region, while growth seemed less noticeable in EMEA.