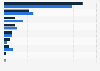
Passenger car sales volume growth rate in Hungary 2017-2021
Sales of passenger cars in Hungary followed an increasing trend between 2016 and 2019 peaking at 158 thousand units. However, the volume of passenger cars sold in the country decreased by approximately 19 percent between 2019 and 2020.