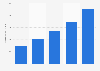
The leading reason consumers in the United States had not yet used cannabidiol (CBD) as of 2022 was finding no need to do so. Following that, a further 19 and 16 percent of respondents were concerned about lack of proper regulation and association with marijuana.
Why are you not likely to purchase CBD products?
Basic Account
Get to know the platform
You only have access to basic statistics.
This statistic is not included in your account.
Starter Account
The ideal entry-level account for individual users
- Instant access to 1m statistics
- Download in XLS, PDF & PNG format
- Detailed references
$199 USD / Month *
Professional Account
Full access
Business Solutions including all features.
* Prices do not include sales tax.
Other statistics that may interest you Statistics on
About the industry
9
- Premium Statistic U.S. adults CBD product usage 2019, by age group
- Premium Statistic U.S. adults who are familiar with CBD oil in 2019, by age group
- Premium Statistic CBD level compared to label US 2020, by type
- Premium Statistic Share of CBD products containing illegal THC levels U.S. 2020, by type
- Premium Statistic CBD product availability in the U.S. 2019, by channel
- Premium Statistic CBD product dollars sales in the United States from 2022 to 2026
- Premium Statistic CBD-infused coffee consumption in the U.S. in 2020, by coffee type
- Premium Statistic CBD impulse purchases in the U.S. 2019
- Premium Statistic U.S. current cannabis consumers' expenditure on CBD 2018
About the region
10
- Basic Statistic Oregon registered medical marijuana patients, caregivers, growers and grow sites 2023
- Basic Statistic Oregon registered medical marijuana patients by age 2023
- Basic Statistic Oregon registered medical marijuana patients by condition 2023
- Basic Statistic Oregon registered medical marijuana patients, caregivers, growers, by gender 2023
- Basic Statistic Oregon medical marijuana patient reduced application fee eligibility 2012-2023
- Premium Statistic U.S. legal cannabis industry: market share by state 2025
- Premium Statistic Canadian and U.S. publically traded marijuana companies market cap 2017
- Premium Statistic Tax revenues from sales of recreational marijuana United States 2022, by state
- Basic Statistic Colorado current active medical marijuana patients 2017-2022 by month
- Premium Statistic Support for U.S. marijuana legalization 2000-2023, by age
Other regions
10
- Premium Statistic Market penetration of CBD products worldwide 2019-2027, by segment
- Basic Statistic Oregon's medical cannabis sales value U.S. 2018-2024
- Basic Statistic Vermont's medical cannabis sales value U.S. 2018-2024
- Basic Statistic Illinois' medical cannabis sales value U.S. 2018-2024
- Basic Statistic Number of licensed medical marijuana producers in Canada as of 2020, by region
- Basic Statistic Maine's medical cannabis spending 2018-2024
- Basic Statistic Favorite aspects of CBD products in U.S. and abroad 2017
- Basic Statistic U.S. medical cannabis physician perceived benefits as of 2017
- Premium Statistic Countries in Africa with the largest cannabis markets 2018
- Premium Statistic Massachusetts' medical cannabis spending 2018-2024
Related statistics
10
- Premium Statistic Number of cannabis stores in Canada by region 2023
- Premium Statistic Global legal cannabis sales share in 2020, by region
- Premium Statistic Share of cannabis growing operations in the U.S. in 2021, by region
- Premium Statistic Share of cannabis cultivation operation revenue in the US in 2021
- Premium Statistic Methods used to process cannabis in cultivation operations in the U.S. in 2021
- Premium Statistic Change in cannabis cultivation operation revenue in the U.S. in 2016-2021
- Premium Statistic Share in change in profits from cannabis cultivation in the United States in 2021
- Premium Statistic Conditions in which cannabis was cultivated in the United States 2016-2021
- Premium Statistic Average square footage of cannabis production areas in the United States 2016-2021
- Premium Statistic Share of cannabis production size in the United States in 2021
Further related statistics
1
Further Content: You might find this interesting as well
Provoke Insights. (September 13, 2022). Why are you not likely to purchase CBD products? [Graph]. In Statista. Retrieved April 24, 2024, from https://www.statista.com/statistics/1330225/reasons-for-cbd-avoidance-us/
Provoke Insights. "Why are you not likely to purchase CBD products?." Chart. September 13, 2022. Statista. Accessed April 24, 2024. https://www.statista.com/statistics/1330225/reasons-for-cbd-avoidance-us/
Provoke Insights. (2022). Why are you not likely to purchase CBD products?. Statista. Statista Inc.. Accessed: April 24, 2024. https://www.statista.com/statistics/1330225/reasons-for-cbd-avoidance-us/
Provoke Insights. "Why Are You Not Likely to Purchase Cbd Products?." Statista, Statista Inc., 13 Sep 2022, https://www.statista.com/statistics/1330225/reasons-for-cbd-avoidance-us/
Provoke Insights, Why are you not likely to purchase CBD products? Statista, https://www.statista.com/statistics/1330225/reasons-for-cbd-avoidance-us/ (last visited April 24, 2024)
Why are you not likely to purchase CBD products? [Graph], Provoke Insights, September 13, 2022. [Online]. Available: https://www.statista.com/statistics/1330225/reasons-for-cbd-avoidance-us/