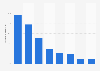
As of February 25, 2023, goods and services under sanctions on Russia over the invasion of Ukraine made up 58 percent of the total import value of the European Union (EU) from Russia in 2021. Furthermore, export bans on goods and technology affected almost half of the EU's exports to Russia in 2021.
Share of trade value of the European Union (EU) with Russia under sanctions as of February 25, 2023, by category (based on exports in 2021)
Basic Account
Get to know the platform
You only have access to basic statistics.
This statistic is not included in your account.
Starter Account
The ideal entry-level account for individual users
- Instant access to 1m statistics
- Download in XLS, PDF & PNG format
- Detailed references
$199 USD / Month *
Professional Account
Full access
Business Solutions including all features.
* Prices do not include sales tax.
Other statistics that may interest you Statistics on
About the industry
10
- Premium Statistic Trade balance of the European Union with China 2012-2022
- Premium Statistic U.S. goods imports from Mexico under NAFTA 1994-2020
- Premium Statistic Canadian goods exports to the European Union 2005-2021
- Premium Statistic EU trade balance with China 2022, by product category
- Premium Statistic Northern Irish imports out of total for merchandise trade in Ireland 2005-2020
- Premium Statistic EU non-food imports breakdown in the United Kingdom (UK) 2016, by product type
- Premium Statistic EU food imports breakdown in the United Kingdom (UK) 2016, by product type
- Basic Statistic Value of imports from EU into India FY 2023, by origin country
- Premium Statistic Import value of goods in Chongqing, China 2014-2023
- Premium Statistic Value of U.S. agricultural imports from the European Union 1990-2023
About the region
10
- Premium Statistic EAEU's trade balance with the EU 2011-2021
- Premium Statistic Distribution of EAEU imports in 2021, by commodity
- Premium Statistic EAEU's trade volume with the EU 2011-2021
- Premium Statistic EAEU import value in 2021, by country group
- Premium Statistic Export value in Russia 2020-2021, by product category
- Premium Statistic Import value in Russia 2020-2021, by commodity group
- Basic Statistic Persons and entities under EU & U.S. sanctions on Russia 2021, by reason
- Basic Statistic Companies under EU and U.S. sanctions on Russia 2021, by sector
- Premium Statistic Trade volume of Russia with African countries 2018, by commodity
- Basic Statistic Import value of clothing accessories in Russia 2011-2022
Selected statistics
2
Other regions
10
- Premium Statistic South Korea's imports from ASEAN countries value 2012-2022
- Premium Statistic Northern Ireland (UK) exports to European Union (EU) markets 2020, by country
- Premium Statistic Value of chemicals imported to the UK 2010-2021
- Premium Statistic Value of iron and steel trade trade with the EU from Egypt 2017
- Premium Statistic U.S. goods exports to Mexico under NAFTA 1994-2019
- Premium Statistic Value of exported machinery and vehicles from Greenland 2014-2019
- Premium Statistic Composition of trade in Nigeria 2021
- Premium Statistic Export value to Europe from Kuwait 2010-2019
- Basic Statistic Italy's balance of trade 2017-2021
- Premium Statistic Main oral/ dental hygiene products import partners of Denmark 2022, by import value
Related statistics
10
- Basic Statistic Import value from Russia in Turkey 2010-2021
- Basic Statistic Goods import value from Russia in Germany 2010-2021
- Premium Statistic German goods export value to Russia 2010-2022
- Premium Statistic Trade revenue of Russia with African countries 2021, by partner
- Premium Statistic Volume of trade between Russia and African countries 2013-2021
- Basic Statistic Concern over Western sanctions in Russia 2014-2023
- Basic Statistic Individual impact of Western sanctions in Russia 2020-2023
- Premium Statistic U.S. merchandise trade value with Russia monthly 2014-2024
- Premium Statistic Public perception of economy in Russia 2006-2022
- Basic Statistic Export value to Russia from South Korea 2010-2021
Further Content: You might find this interesting as well
Euronews. (February 27, 2023). Share of trade value of the European Union (EU) with Russia under sanctions as of February 25, 2023, by category (based on exports in 2021) [Graph]. In Statista. Retrieved April 24, 2024, from https://www.statista.com/statistics/1369401/share-of-eu-russia-trade-under-sanctions/
Euronews. "Share of trade value of the European Union (EU) with Russia under sanctions as of February 25, 2023, by category (based on exports in 2021)." Chart. February 27, 2023. Statista. Accessed April 24, 2024. https://www.statista.com/statistics/1369401/share-of-eu-russia-trade-under-sanctions/
Euronews. (2023). Share of trade value of the European Union (EU) with Russia under sanctions as of February 25, 2023, by category (based on exports in 2021). Statista. Statista Inc.. Accessed: April 24, 2024. https://www.statista.com/statistics/1369401/share-of-eu-russia-trade-under-sanctions/
Euronews. "Share of Trade Value of The European Union (Eu) with Russia under Sanctions as of February 25, 2023, by Category (Based on Exports in 2021)." Statista, Statista Inc., 27 Feb 2023, https://www.statista.com/statistics/1369401/share-of-eu-russia-trade-under-sanctions/
Euronews, Share of trade value of the European Union (EU) with Russia under sanctions as of February 25, 2023, by category (based on exports in 2021) Statista, https://www.statista.com/statistics/1369401/share-of-eu-russia-trade-under-sanctions/ (last visited April 24, 2024)
Share of trade value of the European Union (EU) with Russia under sanctions as of February 25, 2023, by category (based on exports in 2021) [Graph], Euronews, February 27, 2023. [Online]. Available: https://www.statista.com/statistics/1369401/share-of-eu-russia-trade-under-sanctions/