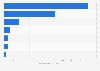
The statistic represents assets of US households and nonprofit organizations held in open-market papers from 1990 to 2011. In 2008, households and nonprofit organizations held approximately 6 billion US dollars in open market paper.
Assets of U.S. households and nonprofit organizations held in open-market paper from 1990 to 2011 (in billion U.S. dollars)
Basic Account
Get to know the platform
You only have access to basic statistics.
This statistic is not included in your account.
Starter Account
The ideal entry-level account for individual users
- Instant access to 1m statistics
- Download in XLS, PDF & PNG format
- Detailed references
$149 USD / Month *
Professional Account
Full access
Business Solutions including all features.
* Prices do not include sales tax.
Other statistics that may interest you Statistics on
About the industry
10
- Premium Statistic Life insurance assets held by U.S. households and NPO's 2000-2018
- Basic Statistic Time and savings deposits of households and nonprofit organizations U.S. 2000-2022
- Premium Statistic Venture capital investments value in Poland 2010-2022
- Premium Statistic Largest Venture Capital investments in Poland 2022
- Premium Statistic Number of Venture Capital funds in Poland 2016-2022
- Premium Statistic Share of startups that received VC funding in Poland 2022, by branch
- Premium Statistic Venture capital investments value in the CEE region 2013-2019
- Premium Statistic Number of venture capital (pre)seed round in Poland 2013-2019
- Premium Statistic Average size of venture capital (pre)seed round in Poland 2013-2019
- Premium Statistic Combined market value of the top 5% of Polish startups 2013-2019
About the region
10
- Premium Statistic Corporate and foreign bonds held by U.S. households & NPO's 2000-2018
- Premium Statistic Assets of U.S. households & NPOs in agency & GSE-backed securities 2000-2018
- Premium Statistic Assets held by U.S. households and NPOs in treasury securities 2000-2018
- Basic Statistic Number of homes sold for cash in the U.S. 1988-2022
- Basic Statistic Mortgage debt outstanding of U.S. real estate investment trusts 2000-2018
- Basic Statistic Mortgage originations in the U.S. 2012-2022, with a forecast until 2024
- Premium Statistic Venture capital fundraising in the U.S. 2009-2022
- Premium Statistic Value of Chinese direct investments in the U.S. 2010-2020
- Premium Statistic Financing products of small companies in the U.S. 2018
- Premium Statistic Value of funds raised by private equity companies in the U.S. 1985-2015
Selected statistics
2
Other regions
10
- Premium Statistic Value of private equity dry powder globally 2003-2022
- Premium Statistic Homeowners with financial help from family for house purchase the UK 2019, by age
- Premium Statistic Share of private equity divestments at cost in Europe 2021, by region
- Basic Statistic Total investment of private equity companies on Italian market 2007-2016
- Premium Statistic Private equity sector investments on the Dutch market 2016
- Basic Statistic Private equity sector investments on the Finnish market 2016
- Basic Statistic Private equity sector investments in Sweden 2016
- Basic Statistic Total investment of private equity firms on Norwegian market 2007-2016
- Basic Statistic Private equity sector investments in Spain 2016
- Basic Statistic Total investment of private equity companies in Bulgaria 2007-2016
Related statistics
10
- Premium Statistic Assets held by U.S. households and NPOs in money market fund shares 2000-2018
- Premium Statistic Gross private financial assets in selected countries worldwide 2019-2021
- Basic Statistic Total financial assets of U.S. households 2000-2022
- Premium Statistic Net financial assets per capita 2022, by country
- Premium Statistic Gross financial assets per capita 2020, by country
- Premium Statistic Largest initial public offerings by funds raised in Europe 2019
- Premium Statistic Financial assets of U.S. security brokers and dealers 2000-2018
- Basic Statistic Equity holdings by U.S. private pension funds 2000-2018
- Premium Statistic Equities held by U.S. state and local government retirement funds 2000-2018
- Premium Statistic Net purchases of U.S. private pension funds equities 2000-2018
Further related statistics
10
- Prepaid debit card use in U.S. households 2013-2019, by tenure
- Senior chief financial officer salary per annum in Switzerland 2023
- Return on average common shareholder equity at Goldman Sachs 2009-2022
- Net revenue from investment banking at Goldman Sachs 2009-2022
- Workforce of not-for-profit theaters in the U.S. 2009-2021
- Not-profit theaters earned income through single ticket sales in the U.S. 2017-2021
- Not-for-profit theaters' aggregate number of performances in the U.S. 2017-2021
- Not-for-profit theaters' average contributed income in the U.S. 2017-2021
- Number of TV households in the UK 2013-2022
- Net revenue from investing and lending at Goldman Sachs 2009-2021
Further Content: You might find this interesting as well
Statistics
- Prepaid debit card use in U.S. households 2013-2019, by tenure
- Senior chief financial officer salary per annum in Switzerland 2023
- Return on average common shareholder equity at Goldman Sachs 2009-2022
- Net revenue from investment banking at Goldman Sachs 2009-2022
- Workforce of not-for-profit theaters in the U.S. 2009-2021
- Not-profit theaters earned income through single ticket sales in the U.S. 2017-2021
- Not-for-profit theaters' aggregate number of performances in the U.S. 2017-2021
- Not-for-profit theaters' average contributed income in the U.S. 2017-2021
- Number of TV households in the UK 2013-2022
- Net revenue from investing and lending at Goldman Sachs 2009-2021
ProQuest. (December 31, 2012). Assets of U.S. households and nonprofit organizations held in open-market paper from 1990 to 2011 (in billion U.S. dollars) [Graph]. In Statista. Retrieved December 09, 2023, from https://www.statista.com/statistics/188388/us-household-and-npo-assets-held-in-open-market-paper/
ProQuest. "Assets of U.S. households and nonprofit organizations held in open-market paper from 1990 to 2011 (in billion U.S. dollars)." Chart. December 31, 2012. Statista. Accessed December 09, 2023. https://www.statista.com/statistics/188388/us-household-and-npo-assets-held-in-open-market-paper/
ProQuest. (2012). Assets of U.S. households and nonprofit organizations held in open-market paper from 1990 to 2011 (in billion U.S. dollars). Statista. Statista Inc.. Accessed: December 09, 2023. https://www.statista.com/statistics/188388/us-household-and-npo-assets-held-in-open-market-paper/
ProQuest. "Assets of U.S. Households and Nonprofit Organizations Held in Open-market Paper from 1990 to 2011 (in Billion U.S. Dollars)." Statista, Statista Inc., 31 Dec 2012, https://www.statista.com/statistics/188388/us-household-and-npo-assets-held-in-open-market-paper/
ProQuest, Assets of U.S. households and nonprofit organizations held in open-market paper from 1990 to 2011 (in billion U.S. dollars) Statista, https://www.statista.com/statistics/188388/us-household-and-npo-assets-held-in-open-market-paper/ (last visited December 09, 2023)
Assets of U.S. households and nonprofit organizations held in open-market paper from 1990 to 2011 (in billion U.S. dollars) [Graph], ProQuest, December 31, 2012. [Online]. Available: https://www.statista.com/statistics/188388/us-household-and-npo-assets-held-in-open-market-paper/