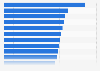
This statistic presents the assets held by households and nonprofit organizations (NPOs) in treasury securities in the United States from 2000 to 2018. In 2018, the assets held by U.S. households and NPOs in treasury securities was 1.9 trillion U.S. dollars.
Assets held by households and nonprofit organizations in treasury securities in the United States from 2000 to 2018 (in billion U.S. dollars)
Basic Account
Get to know the platform
You only have access to basic statistics.
This statistic is not included in your account.
Starter Account
The ideal entry-level account for individual users
- Instant access to 1m statistics
- Download in XLS, PDF & PNG format
- Detailed references
$189 USD $149 USD / Month *
in the first 12 months
Professional Account
Full access
Business Solutions including all features.
* Prices do not include sales tax.
Other statistics that may interest you Statistics on
About the industry
10
- Premium Statistic Corporate and foreign bonds held by U.S. households & NPO's 2000-2018
- Premium Statistic Assets of U.S. households & NPOs in agency & GSE-backed securities 2000-2018
- Basic Statistic Volume of mortgaged-backed securities outstanding U.S. 2000-2021
- Basic Statistic Average daily trading volume of U.S. corporate debt market 2005-2018
- Basic Statistic Volume of U.S. treasury securities outstanding 2000-2018
- Basic Statistic Volume of U.S. municipal securities outstanding 2000-2018
- Basic Statistic New issue volume of U.S. treasury securities 2000-2018
- Premium Statistic New issue volume of U.S. federal agency debt market 2000-2018
- Basic Statistic New issue volume of municipal debt market 2000-2018
- Basic Statistic Volume of U.S. corporate debt securities outstanding 2000-2018
About the region
10
- Basic Statistic Number of homes sold for cash in the U.S. 1988-2022
- Basic Statistic Mortgage debt outstanding of U.S. real estate investment trusts 2000-2018
- Basic Statistic Mortgage originations in the U.S. 2012-2022, with a forecast until 2024
- Premium Statistic Venture capital fundraising in the U.S. 2009-2022
- Premium Statistic Value of Chinese direct investments in the U.S. 2010-2020
- Premium Statistic Financing products of small companies in the U.S. 2018
- Premium Statistic Value of funds raised by private equity companies in the U.S. 1985-2015
- Premium Statistic Number of private equity-backed companies in the U.S. 2004-2013
- Basic Statistic U.S. aid to Israel from 1949 to 2010
- Premium Statistic U.S. military grants to Israel from 1974 to 2010
Other regions
10
- Premium Statistic Value of private equity dry powder globally 2003-2022
- Premium Statistic Homeowners with financial help from family for house purchase the UK 2019, by age
- Premium Statistic Share of private equity divestments at cost in Europe 2021, by region
- Basic Statistic Total investment of private equity firms on Norwegian market 2007-2016
- Basic Statistic Total investment of private equity firms on Ukrainian market 2007-2016
- Basic Statistic Total investment of private equity companies in Hungary 2007-2016
- Basic Statistic Total investment of private equity companies in Greece 2007-2016
- Premium Statistic Private equity sector investments on the Dutch market 2016
- Basic Statistic Private equity investments by Austrian companies 2014-2016, by region
- Basic Statistic Private equity sector investments on the Irish market 2016
Related statistics
10
- Premium Statistic Largest initial public offerings by funds raised in Europe 2019
- Basic Statistic Financial assets of U.S. asset-backed securities issuers 2000-2018
- Premium Statistic Life insurance assets held by U.S. households and NPO's 2000-2018
- Premium Statistic Pension entitlements held by U.S. households and NPO's 2000-2018
- Premium Statistic Aum of the largest hedge fund firms globally 2023
- Premium Statistic Number of worldwide regulated open-end funds 2007-2022
- Basic Statistic Share of market securities held by mutual funds in the U.S. in 2022, by security type
- Basic Statistic Net new cash flow to mutual funds in the U.S. 2000-2022, by fund type
- Premium Statistic Total net assets of mutual funds worldwide 2013-2022, by country
- Basic Statistic Distribution of assets regulated open funds globally 2022, by region
Further related statistics
10
- Senior chief financial officer salary per annum in Switzerland 2023
- Return on average common shareholder equity at Goldman Sachs 2009-2022
- Net revenue from investment banking at Goldman Sachs 2009-2022
- Net revenue from investing and lending at Goldman Sachs 2009-2021
- Prepaid debit card use in U.S. households 2013-2019, by tenure
- Financial controller salary per annum in banking in Belgium 2020, by experience
- Annual income: change manager in finance projects London (UK) 2018
- Value of assets managed by global ETFs 2010-2017, by region
- Leading inverse and leveraged ETPs in the U.S. 2016, by performance
- Annual income: auditors in public & charity audit and compliance in London (UK) 2015
Further Content: You might find this interesting as well
Statistics
- Senior chief financial officer salary per annum in Switzerland 2023
- Return on average common shareholder equity at Goldman Sachs 2009-2022
- Net revenue from investment banking at Goldman Sachs 2009-2022
- Net revenue from investing and lending at Goldman Sachs 2009-2021
- Prepaid debit card use in U.S. households 2013-2019, by tenure
- Financial controller salary per annum in banking in Belgium 2020, by experience
- Annual income: change manager in finance projects London (UK) 2018
- Value of assets managed by global ETFs 2010-2017, by region
- Leading inverse and leveraged ETPs in the U.S. 2016, by performance
- Annual income: auditors in public & charity audit and compliance in London (UK) 2015
ProQuest. (December 5, 2019). Assets held by households and nonprofit organizations in treasury securities in the United States from 2000 to 2018 (in billion U.S. dollars) [Graph]. In Statista. Retrieved September 22, 2023, from https://www.statista.com/statistics/188391/us-household-and-npo-assets-held-in-treasury-securities/
ProQuest. "Assets held by households and nonprofit organizations in treasury securities in the United States from 2000 to 2018 (in billion U.S. dollars)." Chart. December 5, 2019. Statista. Accessed September 22, 2023. https://www.statista.com/statistics/188391/us-household-and-npo-assets-held-in-treasury-securities/
ProQuest. (2019). Assets held by households and nonprofit organizations in treasury securities in the United States from 2000 to 2018 (in billion U.S. dollars). Statista. Statista Inc.. Accessed: September 22, 2023. https://www.statista.com/statistics/188391/us-household-and-npo-assets-held-in-treasury-securities/
ProQuest. "Assets Held by Households and Nonprofit Organizations in Treasury Securities in The United States from 2000 to 2018 (in Billion U.S. Dollars)." Statista, Statista Inc., 5 Dec 2019, https://www.statista.com/statistics/188391/us-household-and-npo-assets-held-in-treasury-securities/
ProQuest, Assets held by households and nonprofit organizations in treasury securities in the United States from 2000 to 2018 (in billion U.S. dollars) Statista, https://www.statista.com/statistics/188391/us-household-and-npo-assets-held-in-treasury-securities/ (last visited September 22, 2023)
Assets held by households and nonprofit organizations in treasury securities in the United States from 2000 to 2018 (in billion U.S. dollars) [Graph], ProQuest, December 5, 2019. [Online]. Available: https://www.statista.com/statistics/188391/us-household-and-npo-assets-held-in-treasury-securities/