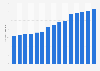
Average daily visits to U.S. NPS sites 2019-2021, by month

Average number of visits per day to National Park Service sites in the United States from January 2019 to December 2021 (in 1,000s), by month

Download
Show detailed source information?
Register for free
Already a member?
Log in
Source

Use Ask Statista Research Service

Release date

May 2022

Region

United States

Survey time period

2019 to 2021

Supplementary notes

Figures for 2019 were retrieved from a previous report.

Citation formats
Statista Accounts: Access All Statistics. Starting from $2,388 USD / Year
Basic Account
Get to know the platform

You only have access to basic statistics.
This statistic is not included in your account.

Starter Account
The ideal entry-level account for individual users
  • Instant access to 1m statistics
  • Download in XLS, PDF & PNG format
  • Detailed references
$199 USD / Month *
Professional Account
Full access

Business Solutions including all features.

* Prices do not include sales tax.

Statistics on " National park tourism in the U.S. "

Other statistics that may interest you National park tourism in the U.S.

Industry overview

7

Visitor spending

4

Visitation figures

8

Outdoor recreation

5

Further related statistics

16
Statista Accounts: Access All Statistics. Starting from $2,388 USD / Year
Learn more about how Statista can support your business.