
- Health & Pharmaceuticals›
- Pharmaceutical Products & Market›
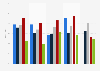
Share of Americans with Medicare health insurance 2018, by age
Industry-specific and extensively researched technical data (partially from exclusive partnerships).
A paid subscription is required for full access.
Share of Americans who have Medicare health insurance in 2018, by age
Exclusive Premium Statistic

Share of respondents | |
---|---|
- | - |
- | - |
- | - |
Share of respondents | |
---|---|
- | - |
- | - |
- | - |
You need a Premium Account for unlimited access.
Full access to 1.5m statistics
Incl. source references
Available to download in PNG, PDF, XLS format
You need a Premium Account for unlimited access.
Full access to 1.5m statistics
Incl. source references
Available to download in PNG, PDF, XLS format
© Statista 2019
About this statistic
Show source
Please be patient - this may take a moment
Description
Source
More information
- Show sources information
- Show publisher information
- Release date
- October 2018
- Region
- United States
- Survey time period
- September 24 to October 24, 2018
- Number of respondents
- 10,448 respondents
- Age group
- 18-64 years
- Special properties
- U.S. residential online population
- Method of interview
- Panel survey
- Supplementary notes
- The original question was: Which type of health insurance do you personally currently have?


You only have access to basic statistics.
This statistic is not included in your account!
- Instant access to 1m statistics
- Download in XLS, PDF & PNG format
- Detailed references
$49 / Month *
Corporate solution including all features.
Prices do not include sales tax.


Statista is a great source of knowledge, and pretty helpful to manage the daily work.Christof Baron
CEO, MindShare Germany
- Overview
- Distribution of U.S. health care expenditure from 2014 to 2018, by payerU.S. health care expenditure distribution by payer 2014-2018
- Percentage of people covered by Medicare in the United States from 1990 to 2017Percentage of U.S. Americans covered by Medicare 1990-2017
- Characteristics of the Medicare population in 2017Characteristics of the Medicare population 2017
- Total Medicare income from 1970 to 2017 (in billion U.S. dollars)*Total Medicare income 1970-2017
- Estimated sources of Medicare revenue in 2017*Estimated Medicare revenue sources 2017
- Total Medicare assets at year-end from 1970 to 2017 (in billion U.S. dollars)Total Medicare assets at year-end 1970-2017
- Spending/costs
- Spending distribution of Medicare and Medicaid in the United States in 2016*Spending distribution of Medicare and Medicaid in the U.S. 2016
- Total Medicare spending from 1970 to 2017 (in billion U.S. dollars)*Total Medicare spending 1970-2017
- Medicare benefit payments by type of service in 2007 and 2017Medicare benefit payments by type of service 2007 vs 2017
- Distribution of Supplementary Medical Insurance (SMI) Medicare benefit payments from 2015 to 2017*Supplementary Medical Insurance Medicare benefit payments 2015-2017
- Distribution of Hospital Insurance (HI) Medicare benefit payments from 2015 to 2017*Hospital Insurance Medicare benefit payments 2015-2017
- Top U.S. not-for-profit hospitals by Medicare patient charges as of 2016 (in billion U.S. dollars)*Leading U.S. not-for-profit hospitals by Medicare patient charges 2016
- Top 10 traditional therapy classes in the U.S. by Medicare per-member-per-year (PMPY) spending in 2016 (in U.S. dollars)*Leading medical traditional therapy areas by Medicare PMPY spending 2016
- Enrollment/beneficiaries
- Enrollment in the Medicare program from 1966 to 2017, by type of beneficiary (in millions)Medicare level of beneficiaries by type of beneficiary 1966-2017
- Distribution of Medicare beneficiaries in 2017, by ethnicityDistribution of Medicare beneficiaries 2017, by ethnicity
- Distribution of Medicare beneficiaries in 2015 and 2016, by federal poverty levelDistribution of Medicare beneficiaries 2015 and 2016, by federal poverty level
- Top 10 U.S. states based on Medicare beneficiaries as a percentage of total population in 2016Top U.S. states by Medicare beneficiaries as a percentage of total population 2016
- Top 10 U.S. states based on number of Medicare beneficiaries in 2016Top U.S. states by number of Medicare beneficiaries 2016
- Infrastructure
- Number of Medicare hospital facilities in the U.S. from 1967 to 2016*Medicare - number of hospital facilities in the U.S. 1967-2016
- Total number of Medicare hospital beds in the U.S. from 1967 to 2016*Medicare - total number of hospital beds in the U.S. 1967-2016
- Number of Medicare skilled nursing facilities in the U.S. from 1967 to 2016*Medicare - number of skilled nursing facilities in the U.S. 1967-2016
- Number of Medicare home health agencies in the U.S. from 1967 to 2016*Medicare - number of home health agencies in the U.S. 1967-2016
- Number of Medicare psychiatric hospital facilities in the U.S. from 1967 to 2016*Medicare - number of psychiatric hospital facilities in the U.S. 1967-2016
- Drugs
- Prescription drugs spending in the United States from 2012 to 2016, by payer (in billion U.S. dollars)Prescription drugs spending in the U.S. by payer 2012-2016
- Medicare Part D payer share of retail prescriptions in 2018, by therapy area*Payer share of Medicare Part D retail prescriptions by therapy class 2018
- Out-of-pocket costs per Medicare Part D retail prescription by therapy area in 2018 (in U.S. dollars)*Out of pocket costs of Medicare Part D retail prescription by drug therapy 2018
- Cost sharing for branded drugs in the Medicare Part D coverage gap from 2016 to 2020Share of branded drug costs in Medicare Part D gap in the U.S. 2016-2020
- Cost sharing for generic drug costs in the Medicare Part D coverage gap from 2016 to 2020 Share of generic drug costs in Medicare Part D gap in the U.S. 2016-2020
- Number of common Medicaid respiratory agent prescriptions annually in 2016 and 2017, by product*Common Medicaid respiratory agent prescriptions by product 2016-2017
- Outlook
- Health spending distribution in the United States 2014-2016 and projections for 2026, by payer*Health spending distribution in the United States by payer 2014-2026
- Medicare outlays and forecast in the United States from 2000 to 2028 (in billion U.S. dollars)U.S. Medicare outlays and forecast 2000-2028
- Medicare outlays and forecast in the United States from 2000 to 2028 (as a percentage of the GDP)U.S. Medicare outlays and forecast 2000-2028 as a percentage of the GDP
- Average annual growth rate in Medicare per capita spending and other measures in the U.S. between 1990s and 2027Annual growth in Medicare per capita spending and other measures 1990-2027
- Costs of care for individuals in the U.S. with Alzheimer's disease to Medicare and Medicaid from 2018 to 2050 (in billion U.S. dollars)Medicare and Medicaid costs from individuals with Alzheimer's in the U.S. 2018-2050
- Share of Americans with Medicaid health insurance 2018, by age
- Share of Americans with POS (Point of Service) health insurance 2018, by age
- Share of Americans with HMO health insurance 2018, by age
- U.S. metro areas: lowest percentage of uninsured residents
- 2011 - Employer-based healthcare coverage in the U.S. by age group
- U.S. metro areas: highest percentage of uninsured residents
- Employer-based healthcare coverage: geographic region
- U.S. Government-based healthcare coverage, by gender 2009
- 2011 - U.S. government healthcare coverage by age group
- 2010 - U.S. government healthcare coverage by age group
- Opioid-related inpatient stays under Medicare U.S. 2010 and 2015, by state
- Major chronic conditions in Medicare spending
- Forecasted average annual growth in Medicare enrollment 2010-2050
- Inadequate health insurance in the U.S.
- Annual Medicare payments for sleep testing in the U.S. 2001-2009
- Share of Americans with military health insurance (CHAMPUS/TRICARE) 2018, by age
- Share of Americans with PPO health insurance 2018, by age
- Percentage of people covered by Medicare in the United States from 1990 to 2017
- Characteristics of the Medicare population in 2017
- Total Medicare income from 1970 to 2017 (in billion U.S. dollars)*
- Estimated sources of Medicare revenue in 2017*
- Total Medicare assets at year-end from 1970 to 2017 (in billion U.S. dollars)
- Spending distribution of Medicare and Medicaid in the United States in 2016*
- Total Medicare spending from 1970 to 2017 (in billion U.S. dollars)*
- Top 10 traditional therapy classes in the U.S. by Medicare per-member-per-year (PMPY) spending in 2016 (in U.S. dollars)*
- Distribution of Medicare beneficiaries in 2017, by ethnicity
- Distribution of Medicare beneficiaries in 2015 and 2016, by federal poverty level
- Top 10 U.S. states based on Medicare beneficiaries as a percentage of total population in 2016
- Top 10 U.S. states based on number of Medicare beneficiaries in 2016
- Number of Medicare hospital facilities in the U.S. from 1967 to 2016*
- Number of Medicare home health agencies in the U.S. from 1967 to 2016*
- Number of Medicare psychiatric hospital facilities in the U.S. from 1967 to 2016*
- Prescription drugs spending in the United States from 2012 to 2016, by payer (in billion U.S. dollars)
- Out-of-pocket costs per Medicare Part D retail prescription by therapy area in 2018 (in U.S. dollars)*
- Cost sharing for branded drugs in the Medicare Part D coverage gap from 2016 to 2020
- Cost sharing for generic drug costs in the Medicare Part D coverage gap from 2016 to 2020
- Number of common Medicaid respiratory agent prescriptions annually in 2016 and 2017, by product*
- Health spending distribution in the United States 2014-2016 and projections for 2026, by payer*
- Medicare outlays and forecast in the United States from 2000 to 2028 (in billion U.S. dollars)
- Medicare outlays and forecast in the United States from 2000 to 2028 (as a percentage of the GDP)
- U.S. metro areas with the lowest percentage of uninsured residents in 2010
- Percentage of Americans with government healthcare coverage in 2011, by age group
- Share of opioid-related inpatient stays under Medicare in the U.S. in 2010 and 2015, by state
- Distribution of major chronic conditions most responsible for growth in Medicare spending
- Medicare payments for sleep testing in the U.S. in 2001 and 2009 (in million U.S. dollars)
- Distribution of U.S. health care expenditure from 2014 to 2018, by payer
- Medicare benefit payments by type of service in 2007 and 2017
- Distribution of Supplementary Medical Insurance (SMI) Medicare benefit payments from 2015 to 2017*
- Distribution of Hospital Insurance (HI) Medicare benefit payments from 2015 to 2017*
- Top U.S. not-for-profit hospitals by Medicare patient charges as of 2016 (in billion U.S. dollars)*
- Enrollment in the Medicare program from 1966 to 2017, by type of beneficiary (in millions)
- Total number of Medicare hospital beds in the U.S. from 1967 to 2016*
- Number of Medicare skilled nursing facilities in the U.S. from 1967 to 2016*
- Medicare Part D payer share of retail prescriptions in 2018, by therapy area*
- Average annual growth rate in Medicare per capita spending and other measures in the U.S. between 1990s and 2027
- Costs of care for individuals in the U.S. with Alzheimer's disease to Medicare and Medicaid from 2018 to 2050 (in billion U.S. dollars)
- Share of Americans who have Medicaid/public assistance/welfare health insurance in 2018, by age
- Share of Americans who have POS (Point of Service) health insurance in 2018, by age
- Share of Americans who have HMO (Health Maintenance Organization) health insurance in 2018, by age
- Percentage of Americans with employer-based healthcare coverage in 2011, by age group
- Metro areas in the U.S. with the highest percentage of uninsured residents in 2010
- Percentage of Americans with employer-based healthcare coverage in 2009, by geographic region
- Percentage of Americans receiving healthcare coverage through a government plan in 2009, by gender
- Percentage of Americans with government healthcare coverage in 2011*, by age group
- Projected average annual growth in Medicare enrollment from 2010 to 2050
- Number of persons with inadequate or no health insurance in the U.S. in 2007 (in millions)
- Share of Americans who have military health insurance (CHAMPUS/TRICARE) in 2018, by age
- Share of Americans who have PPO (Preferred Provider Organization) health insurance in 2018, by age
Statista offers dossiers and reports on over 170 industries. With Statista you are always able to make informed decisions and boost your work efficiency.
Internet & Telecommunications
- Social Media
- E-Commerce
- Online Video & Entertainment
- Advertising & Marketing
Consumer Goods & FMCG
- Alcoholic Beverages
- Cleaning Products
- Cosmetics & Personal Care
- Food & Nutrition
Retail & Trade
- Health & Hygiene
- International Trade
- Shopping Behavior
- Sports & Leisure
Travel, Tourism & Hospitality
- Business Travel
- Leisure Travel
- Accomodation
- Restaurants
Society
- Demographics
- Economy
- Education & Science
- Politics & Government
Transportation & Logistics
- Aviation
- Rail Transport
- Vehicles & Road Traffic
- Water Transport
You can only download this statistic as a Premium user.
As a Premium user you get access to the detailed source references and background information about this statistic.
As a Premium user you get access to background information and details about the release of this statistic.
As soon as this statistic is updated, you will immediately be notified via e-mail.
You need at least a Premium Account to use this feature.
This feature is limited to our corporate solutions.
Please contact us to get started with full access to dossiers, forecasts, studies and international data.

Updates on eCommerce, Digital Media, eTravel, eServices and more
- Market figures for 2018 to 2023
- Company and startup profiles
- User demographics

U.S. coal production has steadily declined in the past decade, but has been in the news in recent years due to President Trump's desire to revitalize the industry. This document provides an overview of the key figures, leading companies, and the employment trends in the U.S. coal mining industry.

This new export feature offers
- Structured graphical representation of the data
- Tailored target group analysis
- Option for further processing

The Polish e-commerce market is one of the fastest developing e-commerce markets in Europe. The latest data for Poland is presented in this dossier.

Plastic waste is an issue of global concern. Since China banned the import of recycled plastic, the U.S. has had to make adjustments to its management of plastic waste. This dossier provides an overview of plastic waste in the U.S.

This dossier provides an overview of hedge funds worldwide. Global hedge fund assets, performance, investors, and other topics are highlighted.

The Outdoor Advertising Association of America covers amongst others
- Number of billboards
- Outdoor advertising revenue
- Number of out-of-home displays

Find data, perceptions & more about
- Economic consequences
- Impact on the labor market
- A second referendum

Understand the recent developments in the Spanish eCommerce market!
- URL-related revenues
- Relevant online store KPIs
- eCommerce-related contacts

- Extended statistical dossier
- Insights, explanations & interpretations
- Challenges of the digital future

eCommerce is rapidly becoming a part of the Latin American shopping culture. The dossier includes data on
- Regional online shopping events
- Events by country

The outline of potential impacts of Brexit on UK industries has been updated in the UK Industry Reports.

Italian enterprises invest significantly in digital marketing. Find out about
- Relevant aspects & KPIs
- New trends
- Different strategies

Statista European Football Benchmark
- The big 5 European leagues
- All about the clubs & fans
- Sponsors & how they fit in

What are online shoppers' payment preferences around the world?
- Data on all payment methods
- Analysis for 50 countries
- Forecasts up to 2023

The kingdom of Saudi Arabia has faced political challenges.
- Perceptions & trade information
- Conflicts with Yemen, Iran, Qatar & Turkey
We use cookies to personalize contents and ads, offer social media features, and analyze access to our website. In your browser settings you can configure or disable this, respectively, and can delete any already placed cookies. For details, please see your browser’s Help section (by pressing F1). Please see our privacy statement for details about how we use data.