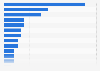
- Media & Advertising›
- Radio, TV & Film›
Number of viewers (on broadcast TV) of an NHL regular season event in the U.S. 2017
Industry-specific and extensively researched technical data (partially from exclusive partnerships).
A paid subscription is required for full access.
Number of people who watched a National Hockey League regular season event on broadcast TV within the last 12 months in the United States from spring 2008 to spring 2017 (in millions)
Exclusive Premium Statistic

Description

The data for this statistic will be available again soon.
Sign up now for free and add the statistic to your favorites. We will notify you as soon as the statistic has been updated.
Already have a Statista account? Log in now.


You only have access to basic statistics.
This statistic is not included in your account!
- Instant access to 1m statistics
- Download in XLS, PDF & PNG format
- Detailed references
$49 / Month *
Corporate solution including all features.
Prices do not include sales tax.


I think of Statista as Google for researchers. Statista provides you with the information you search for right away.Dr. Horst Stipp
EVP, Research & Innovation, Advertising Research Foundation
- Industry financials
- Compound annual growth rate of the media and entertainment spending in the United States between 2016 and 2021, by sectorGrowth of the media and entertainment spending in the U.S. 2016-2021, by sector
- Estimated revenue of TV broadcasters in the United States from 2005 to 2017 (in million U.S. dollars)Revenue of U.S. TV broadcasters 2005-2017
- Revenue of TV broadcasters in the United States from 2010 to 2017, by source (in billion U.S. dollars)Revenue of U.S. TV broadcasters 2010-2017, by source
- Estimated expenses of U.S. TV broadcasters from 2007 to 2017 (in billion U.S. dollars)Expenses of U.S. television broadcasters 2007-2017
- Local television station revenue in the United States from 2016 to 2020 (in billion U.S. dollars)Local TV station revenues in the U.S. 2016-2020
- Television subscription revenue in the United States from 2011 to 2020 (in billion U.S. dollars)TV subscription revenue in the U.S. 2011-2020
- Value of mergers and acquisitions of local TV stations in the United States from 1996 to 2017 (in billion U.S dollars)Local TV: M&A value in the U.S. 1996-2017
- Revenue of television stations in the United States in 2016, by owner typeRevenue of the TV stations in the U.S. 2016, by owner
- Market data
- Number of commercial TV stations in the United States from 1950 to 2017Number of commercial TV stations in the U.S. 1950-2017
- Number of TV households in the United States from season 2000-2001 to season 2018-2019 (in millions)Number of TV households in the U.S. 2000-2019
- Number of TV households in North America from 2010 to 2021, by platform (in millions)Number of TV households in North America 2010-2021, by platform
- Number of TV households in the largest local TV markets in the United States in the broadcast season 2018-2019TV households in the largest local TV markets in the U.S. 2019
- Weekly TV reach in the United States as of March 2018, by age groupTV reach in the U.S. Q1 2018, by age
- TV reach in the United States as of November 2017, by time periodTV reach in the U.S. 2017, by time period
- Reach of TV shows/episodes on a typical weekday in the United States as of January 2018, by daypartTV shows/episodes reach on weekdays in the U.S. 2018, by daypart
- Internet-connected TV penetration rate in the United States from 2014 to 2017Connected TV penetration rate in the U.S. 2017
- Employment data
- Total employment in U.S. broadcasting industries from 2001 to 2018 (in 1,000s)Employment in U.S. broadcasting industries 2001-2018
- Unemployment rate in the U.S. broadcasting* industry from 2001 to 2017Unemployment rate in the U.S. broadcasting industry 2001-2017
- Average hourly earnings of all employees in U.S. broadcasting industries from 2007 to 2017 (in U.S. dollars)Average hourly earnings in U.S. broadcasting industries 2007-2017
- Market leaders
- Leading cable networks in the United States in 2017, by number of primetime viewers (in millions)Leading cable networks in the U.S. 2017
- Leading cable networks in the United States in February 2019, by number of primetime viewers (in millions)Cable networks: number of primetime viewers in the U.S. February 2019
- Leading cable networks in the United States as of February 2019, by number of total day viewers (in thousands)Cable networks: number of viewers in the U.S. February 2019
- Leading ad supported broadcast and cable networks in the United States in 2018, by average number of viewersMost watched TV networks in the U.S. 2018
- Leading cable news networks in the United States in January 2019, by number of primetime viewers (in 1,000s)U.S. cable news networks: number of viewers January 2019
- Leading new network TV series in the United States in the 2016-17 season, by number of viewers (in millions)Most watched new network TV series in the U.S. 2016
- Level of trust in TV networks in the United States in 2017, by genreTrust in TV networks U.S. 2017
- Combined evening news audiences on U.S. television networks from 2016 to 2017 (in millions)Evening news audiences on U.S. television networks 2016-2017
- Consumer behavior
- Weekly TV reach in the United States as of March 2018, by age groupTV reach in the U.S. Q1 2018, by age
- Change in TV content viewing habits among pay TV subscribers in the United States in 2017, by deviceChange in pay TV content viewing habits in the U.S. 2017, by device
- How do you most often decide to watch a new TV series?Leading sources of discovering new TV shows among Millennials in the U.S. 2017
- Distribution of binge viewers in the United States in the United States in 2017, by ageBinge viewing habits in the United States in 2017, by age
- Share of binge-watchers in the United States as of April 2018, by genderBinge-watchers in the U.S. 2018, by gender
- Most common reasons for binge-watching TV series in the United States as of April 2018Binge-viewing reasons in the U.S. 2018
- Would you prefer the ability to make your own pay TV package by selecting only the channels you want to watch?Interest in tailored pay-TV packages in North America 2017
- TV consumption methods of Millennials in the United States as of April 2017Ways in which Millennials watch TV in the U.S. as of 2017
- Time spent
- Daily time spent watching TV per capita in the United States from 2013 to 2020 (in minutes)U.S. media usage - time spent watching television 2013-2020
- Daily time spent watching live TV in the United States in November 2017, by city (in hours)Time spent watching live TV in the U.S. November 2017, by city
- Average daily time spent watching TV per capita in the United States in 2017, by gender (in hours)U.S. TV consumption: average viewing time in 2017, by gender
- Average daily time spent watching TV per capita in the United States in 2017, by age group (in hours)U.S. TV consumption: daily viewing time in 2017, by age
- Weekly time spent with TV among young adults in the United States from 1st quarter 2011 to 2nd quarter 2017 (in minutes)Time spent with TV among young adults in the U.S. 2011-2017
- Weekly time 12- to 17-year-olds spend watching TV in the United States in 1st quarter 2018, by source (in minutes)Time U.S. teens spent with TV 2018
- Weekly time spent watching TV among Baby Boomers in the United States in 1st quarter 2018, by platform (in minutes)Baby Boomers: weekly time spent watching TV Q1 2018
- Content
- Number of original scripted TV series in the United States from 2009 to 2018Number of scripted TV series in the U.S. 2009-2018
- Are you satisfied with the amount of shows and movies available on cable/satellite television?Satisfaction among U.S. consumers with amount of shows/movies available on TV 2017
- Leading syndicated TV programs in the United States from August 2016 to August 2017Leading syndicated programs on U.S. TV 2017
- Leading single telecast TV programs in the United States in 2018, based on total viewers (in millions)Top 10 single telecast TV programs in the U.S. 2018
- Leading favorite contemporary TV shows according to Millennials in the United States as of April 2018, by rating scoreContemporary TV shows with the highest ratings among Millennials in the U.S. 2018
- Leading TV series in the United States as of March 2018, by production costs per episode (in million U.S. dollars)Most expensive TV shows produced as of 2018
- Leading offline news brands accessed in the United States as of February 2018Leading offline news brands in the U.S. 2018
- Leading cable news networks in the United States in 2017, by number of primetime viewers (in thousands)U.S. cable news: number of primetime viewers in 2017
- Advertising
- Local TV advertising spending in the United States from 2010 to 2021 (in billion U.S. dollars)Local TV ad spend in the U.S. 2010-2021
- Leading advertisers on cable TV networks in the United States in 2017, by ad spend (in million U.S. dollars)Largest advertisers on cable TV networks in the U.S. 2017
- Share of online TV in TV advertising revenue in the United States from 2012 to 2018Share of online TV in TV advertising revenue in the U.S. 2012-2018
- Long-form direct response TV (DRTV) advertising spending in the United States from 4th quarter 2011 to 4th quarter 2017 (in million U.S. dollars)Long-form DRTV ad spend in the U.S. 2005-2017
- Short-form direct response TV (DRTV) advertising spending in the United States from 4th quarter 2010 to 4th quarter 2017 (in million U.S. dollars)Short-form DRTV quarterly spend in the U.S. 2010-2017
- Leading movie commercials in the United States in week ending February 17, 2019, by television advertising spending (in million U.S. dollars)Leading trailers in the U.S. February 2019, by weekly TV ad spend
- Leading TV shows on broadcast TV in the United States during the 2018/19 TV season, by cost of a 30-second spot (in U.S. dollars)Priciest shows for advertisers on broadcast TV in the U.S. 2018/19
- Share of viewers of IndyCar Series events on broadcast TV in the U.S. 2018, by age
- People who watch American Hockey League events in the U.S. on broadcast TV, 2017
- Share of Americans who watch high school sports events on broadcast TV 2018, by age
- Viewers of a NBA Development League event in the U.S. 2016
- Gender breakdown of NHL television audience in 2012-2013 regular season
- Fans of NHL hockey in Canada 2014, by age group
- Television viewership of the NHL Stanley Cup Finals 2012-2014
- Frequency of watching sports within households in the United Kingdom (UK) 2014
- Interest in comedy on television in Germany 2014-2018
- Interest in history television programs in Germany 2014-2018
- Interest in arts and culture television programs in Germany 2014-2018
- Age breakdown of NHL TV audience during 2012-2013 regular sesason
- Distribution of NHL regular season TV audience by ethnicity 2013
- Commercial TV reach in Finland 2017, by age group
- How important people think hockey is to Canada's culture and society 2014
- Reach and market share of political TV shows in Germany 2014
- Consumer opinion on TV quality in the UAE 2013
- Value of communication and broadcasting electronics production in India 2010-2014
- Purchase reasons for TVs in France 2014
- Italy: share of video and television firms using using Cloud Computing 2016, by type
- Television consumption in France
- Television in Sweden
- Television industry in the United Kingdom (UK)
- Television in the U.S.
- Television in Canada
- Television industry in Italy
- Television in Germany
- Television industry in India
- Television industry worldwide
- Television industry in Europe
- Television market in Denmark
- Television market in Norway
- Television industry in Belgium
- Satellite television in the United Kingdom (UK)
- Television industry in the Netherlands
- Estimated expenses of U.S. TV broadcasters from 2007 to 2017 (in billion U.S. dollars)
- Revenue of television stations in the United States in 2016, by owner type
- Number of TV households in the largest local TV markets in the United States in the broadcast season 2018-2019
- Average hourly earnings of all employees in U.S. broadcasting industries from 2007 to 2017 (in U.S. dollars)
- Leading cable networks in the United States as of February 2019, by number of total day viewers (in thousands)
- TV consumption methods of Millennials in the United States as of April 2017
- Average daily time spent watching TV per capita in the United States in 2017, by gender (in hours)
- Leading single telecast TV programs in the United States in 2018, based on total viewers (in millions)
- Leading TV series in the United States as of March 2018, by production costs per episode (in million U.S. dollars)
- Leading movie commercials in the United States in week ending February 17, 2019, by television advertising spending (in million U.S. dollars)
- Are you an NHL hockey fan?
- How important is hockey to Canada’s cultural and social fabric?
- When you or other members of your household purchased these products or devices, what were the reasons for purchase?
- Compound annual growth rate of the media and entertainment spending in the United States between 2016 and 2021, by sector
- Estimated revenue of TV broadcasters in the United States from 2005 to 2017 (in million U.S. dollars)
- Revenue of TV broadcasters in the United States from 2010 to 2017, by source (in billion U.S. dollars)
- Local television station revenue in the United States from 2016 to 2020 (in billion U.S. dollars)
- Television subscription revenue in the United States from 2011 to 2020 (in billion U.S. dollars)
- Value of mergers and acquisitions of local TV stations in the United States from 1996 to 2017 (in billion U.S dollars)
- Number of commercial TV stations in the United States from 1950 to 2017
- Number of TV households in the United States from season 2000-2001 to season 2018-2019 (in millions)
- Number of TV households in North America from 2010 to 2021, by platform (in millions)
- Weekly TV reach in the United States as of March 2018, by age group
- TV reach in the United States as of November 2017, by time period
- Reach of TV shows/episodes on a typical weekday in the United States as of January 2018, by daypart
- Internet-connected TV penetration rate in the United States from 2014 to 2017
- Total employment in U.S. broadcasting industries from 2001 to 2018 (in 1,000s)
- Unemployment rate in the U.S. broadcasting* industry from 2001 to 2017
- Leading cable networks in the United States in 2017, by number of primetime viewers (in millions)
- Leading cable networks in the United States in February 2019, by number of primetime viewers (in millions)
- Leading ad supported broadcast and cable networks in the United States in 2018, by average number of viewers
- Leading cable news networks in the United States in January 2019, by number of primetime viewers (in 1,000s)
- Leading new network TV series in the United States in the 2016-17 season, by number of viewers (in millions)
- Level of trust in TV networks in the United States in 2017, by genre
- Combined evening news audiences on U.S. television networks from 2016 to 2017 (in millions)
- Change in TV content viewing habits among pay TV subscribers in the United States in 2017, by device
- How do you most often decide to watch a new TV series?
- Distribution of binge viewers in the United States in the United States in 2017, by age
- Share of binge-watchers in the United States as of April 2018, by gender
- Most common reasons for binge-watching TV series in the United States as of April 2018
- Would you prefer the ability to make your own pay TV package by selecting only the channels you want to watch?
- Share of weekly linear TV content co-viewing time in the United States as of November 2017, by platform
- Share of consumers who access TV content from the internet in the United States from 2015 to 2017, by age
- Would you like to be able to search for TV shows and movies across all of your TV services*?
- Share of pay TV subscribers who get frustrated finding something to watch on TV in North America from 3rd quarter 2013 to 3rd quarter 2017
- Daily time spent watching TV per capita in the United States from 2013 to 2020 (in minutes)
- Daily time spent watching live TV in the United States in November 2017, by city (in hours)
- Average daily time spent watching TV per capita in the United States in 2017, by age group (in hours)
- Weekly time spent with TV among young adults in the United States from 1st quarter 2011 to 2nd quarter 2017 (in minutes)
- Weekly time 12- to 17-year-olds spend watching TV in the United States in 1st quarter 2018, by source (in minutes)
- Weekly time spent watching TV among Baby Boomers in the United States in 1st quarter 2018, by platform (in minutes)
- Number of original scripted TV series in the United States from 2009 to 2018
- Are you satisfied with the amount of shows and movies available on cable/satellite television?
- Leading syndicated TV programs in the United States from August 2016 to August 2017
- Leading favorite contemporary TV shows according to Millennials in the United States as of April 2018, by rating score
- Leading offline news brands accessed in the United States as of February 2018
- Leading cable news networks in the United States in 2017, by number of primetime viewers (in thousands)
- Most popular television shows based on audience demand in the United States from February 3 to February 9, 2019 (in million average demand expressions)
- Most popular linear TV content genres to co-view in the United States as of November 2017
- Local TV advertising spending in the United States from 2010 to 2021 (in billion U.S. dollars)
- Leading advertisers on cable TV networks in the United States in 2017, by ad spend (in million U.S. dollars)
- Share of online TV in TV advertising revenue in the United States from 2012 to 2018
- Long-form direct response TV (DRTV) advertising spending in the United States from 4th quarter 2011 to 4th quarter 2017 (in million U.S. dollars)
- Short-form direct response TV (DRTV) advertising spending in the United States from 4th quarter 2010 to 4th quarter 2017 (in million U.S. dollars)
- Leading TV shows on broadcast TV in the United States during the 2018/19 TV season, by cost of a 30-second spot (in U.S. dollars)
- Share of Americans who watched any IndyCar Series event on broadcast TV in the last 12 months in 2018, by age
- Number of people who watched an American Hockey League event on broadcast TV within the last 12 months in the United States from spring 2008 to spring 2017 (in millions)
- Share of Americans who watched any high school sports event on broadcast TV in the last 12 months in 2018, by age
- Number of people who watched a NBA Development League event on cable TV within the last 12 months in the United States from autumn 2010 to spring 2016 (in thousands)
- Distribution of NHL television audience in 2012-2013 regular season, by gender
- Television viewership of the National Hockey League Stanley Cup Finals from 2012 to 2014 (in millions)
- Frequency of watching sport events on TV with other household members in the United Kingdom (UK) in 2014*
- Number of people interested in comedy on television in Germany from 2014 to 2018, by level of interest (in millions)
- Number of people interested in history programs on television in Germany from 2014 to 2018, by level of interest (in millions)
- Number of people interested in arts and culture programs on television in Germany from 2014 to 2018, by level of interest (in millions)
- Distribution of NHL television audience during the 2012-2013 regular season, by age
- Distribution of NHL television audience during 2012-2013 regular season, by ethnicity
- Daily and weekly reach of commercial television in Finland in 2017, by age group
- Reach and audience market share of political television shows in Germany in 2014
- What do you think of the quality of television programmes in the United Arab Emirates?
- Value of communication and broadcasting electronics production in India from FY 2010 to FY 2014 (in billion Indian rupees)
- Share of motion picture, video and television firms using Cloud Computing in Italy in 2016, by type
Statista offers dossiers and reports on over 170 industries. With Statista you are always able to make informed decisions and boost your work efficiency.
Internet & Telecommunications
- Social Media
- E-Commerce
- Online Video & Entertainment
- Advertising & Marketing
Consumer Goods & FMCG
- Alcoholic Beverages
- Cleaning Products
- Cosmetics & Personal Care
- Food & Nutrition
Retail & Trade
- Health & Hygiene
- International Trade
- Shopping Behavior
- Sports & Leisure
Travel, Tourism & Hospitality
- Business Travel
- Leisure Travel
- Accomodation
- Restaurants
Society
- Demographics
- Economy
- Education & Science
- Politics & Government
Transportation & Logistics
- Aviation
- Rail Transport
- Vehicles & Road Traffic
- Water Transport
You can only download this statistic as a Premium user.
As a Premium user you get access to the detailed source references and background information about this statistic.
As a Premium user you get access to background information and details about the release of this statistic.
As soon as this statistic is updated, you will immediately be notified via e-mail.
You need at least a Premium Account to use this feature.
This feature is limited to our corporate solutions.
Please contact us to get started with full access to dossiers, forecasts, studies and international data.

The Italian pharmaceutical market is among the fastest growing ones worldwide. This dossier provides data on the trends of the market, with special focus on pharmaceutical segments.

To our 150 Reports we added:
- Global Consumer Survey content
- Operational risk index by Fitch
- And more …

The global plastics industry is growing by approximately three percent every year. This dossier provides information about the global plastics industry in general as well as chapters on the major types of plastic, and recycling rates.

Updates on eCommerce, Digital Media, eTravel, eServices and more
- Market figures for 2018 to 2023
- Company and startup profiles
- User demographics

U.S. coal production has steadily declined in the past decade, but has been in the news in recent years due to President Trump's desire to revitalize the industry. This document provides an overview of the key figures, leading companies, and the employment trends in the U.S. coal mining industry.

This new export feature offers
- Structured graphical representation of the data
- Tailored target group analysis
- Option for further processing

The Polish e-commerce market is one of the fastest developing e-commerce markets in Europe. The latest data for Poland is presented in this dossier.

Plastic waste is an issue of global concern. Since China banned the import of recycled plastic, the U.S. has had to make adjustments to its management of plastic waste. This dossier provides an overview of plastic waste in the U.S.

This dossier provides an overview of hedge funds worldwide. Global hedge fund assets, performance, investors, and other topics are highlighted.

The Outdoor Advertising Association of America covers amongst others
- Number of billboards
- Outdoor advertising revenue
- Number of out-of-home displays

Find data, perceptions & more about
- Economic consequences
- Impact on the labor market
- A second referendum

Understand the recent developments in the Spanish eCommerce market!
- URL-related revenues
- Relevant online store KPIs
- eCommerce-related contacts

- Extended statistical dossier
- Insights, explanations & interpretations
- Challenges of the digital future

eCommerce is rapidly becoming a part of the Latin American shopping culture. The dossier includes data on
- Regional online shopping events
- Events by country

The outline of potential impacts of Brexit on UK industries has been updated in the UK Industry Reports.

Italian enterprises invest significantly in digital marketing. Find out about
- Relevant aspects & KPIs
- New trends
- Different strategies

Statista European Football Benchmark
- The big 5 European leagues
- All about the clubs & fans
- Sponsors & how they fit in
We use cookies to personalize contents and ads, offer social media features, and analyze access to our website. In your browser settings you can configure or disable this, respectively, and can delete any already placed cookies. For details, please see your browser’s Help section (by pressing F1). Please see our privacy statement for details about how we use data.