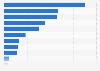
This statistic depicts the top five silver, lead, and zinc deals worldwide in 2014, based on value. In that year, the acquisition of Minera Penmont by Fresnillo was the world's largest deal in the silver, lead, and zinc sector, with a value of some 450 million U.S. dollars.
Top 5 silver, lead, and zinc deals worldwide in 2014, based on value (in million U.S. dollars)
Loading statistic...
Basic Account
Get to know the platform
You only have access to basic statistics.
Starter Account
The ideal entry-level account for individual users
- Instant access to 1m statistics
- Download in XLS, PDF & PNG format
- Detailed references
$199 USD / Month *
Professional Account
Full access
Business Solutions including all features.
* Prices do not include sales tax.
Other statistics that may interest you Statistics on
About the industry
10
- Basic Statistic Leading global mining M&A deals 2022-2023, based on value
- Basic Statistic Number of global mining and metals sector deals by commodity 2017
- Basic Statistic Total value of deals in the mining and metals sector worldwide 2000-2018
- Basic Statistic Value of global mining and metals sector deals 2017 by target region
- Premium Statistic Value of top ten global mining and metals acquisitions 2015
- Basic Statistic Value of global mining and metals sector deals by targeted commodity 2018
- Premium Statistic Number of deals in the mining and metals sector worldwide 2000-2017
- Basic Statistic Top U.S. mining and metals deals based on value 2012
- Basic Statistic Top African mining and metals deals based on value 2012
- Basic Statistic Value and volume of Australian mining and metals deals 2003-2012
About the region
10
- Basic Statistic Global top 5 iron ore deals based on value 2014
- Premium Statistic Number and value of iron ore deals worldwide 2012-2014
- Basic Statistic Mining and metals: emerging markets acquisitions 2010
- Basic Statistic Global number of gold mining acquisition deals 2011-2020
- Premium Statistic Global industrial gases transaction volume 2010-2022
- Premium Statistic Global commodity chemicals number of M&A deals 2011-2022
- Premium Statistic Global chemical deal volume by target sector 2022
- Basic Statistic Global specialty chemicals number of M&A deals 2010-2022
- Basic Statistic Newmont Corporation's revenue 2010-2023
- Premium Statistic Newmont Corporation's net income 2010-2023
Selected statistics
10
- Premium Statistic Rio Tinto's uranium production 2010-2023
- Basic Statistic Rio Tinto's aluminum and copper production 2010-2023
- Premium Statistic Number of Rio Tinto's employees 2010-2023
- Basic Statistic Rio Tinto's net income 2005-2023
- Premium Statistic Glencore's net income 2010-2023
- Premium Statistic Freeport-McMoRan's revenue 2010-2023
- Basic Statistic Freeport-McMoRan's net income 2010-2023
- Basic Statistic Mine lifespan by selected commodities
- Premium Statistic Global barite mine production 2023, by country
- Basic Statistic Global leading silver consumers 2010
Other regions
10
- Premium Statistic Mining industry enterprises New Zealand 2009-2023
- Premium Statistic ROE in the metals and electronics sector in Europe 2019-2023, by industry
- Premium Statistic EV/EBITDA in the metals and electronics sector in China 2019-2023, by industry
- Premium Statistic Number of M&A deals in Italy H1 2021, by sector
- Premium Statistic Annual production of gold in Saudi Arabia 2011-2020
- Basic Statistic Canada's mineral export value 2017, by commodity
- Premium Statistic Newmont's number of employees 2010-2023
- Premium Statistic Annual consumption of refined copper North Korea 2011-2021
- Basic Statistic Gold mine production volume in Ghana 2011-2021
- Premium Statistic Export volume of refined copper Singapore 2012-2021
Related statistics
10
- Premium Statistic Gold production of Newmont Corporation 2010-2023
- Premium Statistic Newmont's copper production 2015-2023
- Premium Statistic World lithium reserves 2023, by country
- Premium Statistic Impact of COVID-19 on M&A activity in the mining sector worldwide 2020-2021
- Premium Statistic Global mineral commodity production share by select country 2019
- Premium Statistic COVID-19 impact on mining and metals industry mergers and acquisitions 2020
- Premium Statistic Global number of active mineral exploration sites 2017, by region and type
- Premium Statistic Number of active mineral exploration sites worldwide by region 2017
- Premium Statistic Distribution of active mineral exploration sites worldwide by region 2017
- Basic Statistic Global distribution of the molybdenum supply by country 2016
Further related statistics
10
- Agnico-Eagle Mines' gold reserves 2000-2022
- Rio Tinto's diamond production 2010-2023
- Iron ore prices 2000-2022
- Thermal coal prices 2013-2022
- Molycorp's revenue 2008-2014
- Global graphite reserves 2023, by country
- Financial advisors ranked by M&A transactions in the UK 2022, by deal value
- Glencore's sales of energy products 2010-2023
- Freeport-McMoRan's copper production 2010-2023
- Global natural gas production 2022, by country
Further Content: You might find this interesting as well
Statistics
- Agnico-Eagle Mines' gold reserves 2000-2022
- Rio Tinto's diamond production 2010-2023
- Iron ore prices 2000-2022
- Thermal coal prices 2013-2022
- Molycorp's revenue 2008-2014
- Global graphite reserves 2023, by country
- Financial advisors ranked by M&A transactions in the UK 2022, by deal value
- Glencore's sales of energy products 2010-2023
- Freeport-McMoRan's copper production 2010-2023
- Global natural gas production 2022, by country
EY. (February 28, 2015). Top 5 silver, lead, and zinc deals worldwide in 2014, based on value (in million U.S. dollars) [Graph]. In Statista. Retrieved April 18, 2024, from https://www.statista.com/statistics/238362/top-5-silver-and-zinc-deals-based-on-value-2011/
EY. "Top 5 silver, lead, and zinc deals worldwide in 2014, based on value (in million U.S. dollars)." Chart. February 28, 2015. Statista. Accessed April 18, 2024. https://www.statista.com/statistics/238362/top-5-silver-and-zinc-deals-based-on-value-2011/
EY. (2015). Top 5 silver, lead, and zinc deals worldwide in 2014, based on value (in million U.S. dollars). Statista. Statista Inc.. Accessed: April 18, 2024. https://www.statista.com/statistics/238362/top-5-silver-and-zinc-deals-based-on-value-2011/
EY. "Top 5 Silver, Lead, and Zinc Deals Worldwide in 2014, Based on Value (in Million U.S. Dollars)." Statista, Statista Inc., 28 Feb 2015, https://www.statista.com/statistics/238362/top-5-silver-and-zinc-deals-based-on-value-2011/
EY, Top 5 silver, lead, and zinc deals worldwide in 2014, based on value (in million U.S. dollars) Statista, https://www.statista.com/statistics/238362/top-5-silver-and-zinc-deals-based-on-value-2011/ (last visited April 18, 2024)
Top 5 silver, lead, and zinc deals worldwide in 2014, based on value (in million U.S. dollars) [Graph], EY, February 28, 2015. [Online]. Available: https://www.statista.com/statistics/238362/top-5-silver-and-zinc-deals-based-on-value-2011/