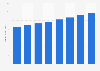
The statistic shows the average spending of anglers on recreational fishing in the United States from 2001 to 2016. In 2016, anglers in the United States spent an average of 1,290 U.S. dollars in connection with fishing.
Average spending of anglers on recreational fishing in the United States from 2001 to 2016 (in U.S. dollars)
Basic Account
Get to know the platform
You only have access to basic statistics.
This statistic is not included in your account.
Starter Account
The ideal entry-level account for individual users
- Instant access to 1m statistics
- Download in XLS, PDF & PNG format
- Detailed references
$69 USD $49 USD / Month *
in the first 12 months
Professional Account
Full access
Business Solutions including all features.
* Prices do not include sales tax.
Other statistics that may interest you
Market Overview
8
- Premium Statistic Revenue of the sports equipment industry worldwide 2014-2027
- Premium Statistic Total revenue of the global sports apparel market 2021-2026
- Premium Statistic Revenue of the athletic footwear industry Worldwide 2018-2028
- Premium Statistic Revenue of the sports equipment industry in the U.S. 2014-2027
- Premium Statistic Sports equipment market revenue in the U.S. from 2014 to 2027, by product type
- Premium Statistic Revenue of the U.S. athletic apparel and swimwear market from 2013 to 2026
- Premium Statistic Revenue of the U.S. athletic apparel and swimwear market, by segment
- Premium Statistic Athletic footwear revenue in the United States 2018-2028
Retail
5
- Premium Statistic U.S. total and e-commerce sports, hobby, instrument, and book stores sales 2004-2021
- Premium Statistic Sporting goods store sales in the U.S. from 1992 to 2021
- Basic Statistic Total mail-order and e-commerce sales of sporting goods in the U.S. 2003-2021
- Premium Statistic Sporting goods store monthly sales in the U.S. from 2017 to 2023
- Premium Statistic U.S. athletic and gymnastic equipment import and export trade value from 2015 to 2022
Wholesale
8
- Basic Statistic Wholesale sales of the U.S. sporting goods industry in the U.S. 2008-2022
- Premium Statistic Wholesale sales of the sports products industry by category 2008-2022
- Premium Statistic Wholesale sales of sports apparel in the U.S. 2008-2022
- Premium Statistic Wholesale sales of athletic footwear in the U.S. 2008-2022
- Premium Statistic U.S. consumer fitness equipment wholesale sales 2007-2022
- Premium Statistic Wholesale sales of sports exercise equipment in the U.S. 2007-2022
- Premium Statistic Institutional fitness equipment wholesale sales in the U.S. 2007-2022
- Premium Statistic Wholesale sales of licensed sports merchandise in the U.S. 2008-2022
U.S. sporting goods manufacturers
7
- Basic Statistic U.S. revenue of Nike from 1988 to 2022
- Basic Statistic Nike's North American revenue 2009-2022, by segment
- Basic Statistic Callaway Golf revenue worldwide 2017-2022, by market
- Basic Statistic Revenue of Callaway Golf worldwide 2017-2022, by product category
- Basic Statistic Under Armour's net revenue in the United States from 2015 to 2020
- Basic Statistic Net sales of Nautilus Inc. in the United States from 2016 to 2022
- Basic Statistic Global revenue of Nautilus Inc. in 2022, by product line
U.S. sporting goods retail stores
8
- Basic Statistic Net sales of Dick's Sporting Goods U.S. 2006-2022
- Basic Statistic Net sales of Dick's Sporting Goods U.S. 2008-2022, by product type
- Basic Statistic Hibbett Sports' net sales in the U.S. from 2015 to 2023
- Basic Statistic Hibbett Sports' net sales in the U.S. from 2017 to 2023, by product category
- Basic Statistic Big 5 Sporting Goods' net sales in the U.S. from 2017 to 2022
- Basic Statistic Big 5 Sporting Goods' dollar sales share in the U.S. in 2022, by product category
- Premium Statistic Bass Pro Shop's retail sales in the U.S. from 2017 to 2021
- Basic Statistic Academy's retail sales in the U.S. from 2017 to 2021
Further related statistics
17
- Industry revenue of “Manufactured fishing and sporting articles“ in Brazil 2014-2025
- Global sports fishing equipment market value forecast from 2017 until 2022
- Breakdown of recreational fishing expenditure in the United States in 2016
- Equipment expenditure in recreational fishing in the United States 2016
- Wildlife-related recreation spending in the United States 2011, by category
- Supplementary equipment expenditure of anglers in the United States in 2016
- Trip-related spending on recreational fishing in the United States in 2016
- Number of paid fishing license holders in the U.S. 2021, by state
- Number of fishing licenses in the United States from 2000 to 2021
- Most commonly used fishing location types in the U.S. 2021
- Number of new, returning and lost fishing participants in the U.S. from 2007 to 2013
- Use of mobile technologies by fishing participants in the U.S. in 2013
- Annual outings of fly fishing participants in the U.S. 2021
- Ethnic distribution of fly fishing participants in the U.S. 2021
- Fishing participation rate South Korea 2019, by gender
- Gender distribution of freshwater fishing participants in the U.S. 2021
- Increase in online purchase intentions for sport & outdoor products in Italy 2021
Further Content: You might find this interesting as well
Statistics
- Industry revenue of “Manufactured fishing and sporting articles“ in Brazil 2014-2025
- Global sports fishing equipment market value forecast from 2017 until 2022
- Breakdown of recreational fishing expenditure in the United States in 2016
- Equipment expenditure in recreational fishing in the United States 2016
- Wildlife-related recreation spending in the United States 2011, by category
- Supplementary equipment expenditure of anglers in the United States in 2016
- Trip-related spending on recreational fishing in the United States in 2016
- Number of paid fishing license holders in the U.S. 2021, by state
- Number of fishing licenses in the United States from 2000 to 2021
- Most commonly used fishing location types in the U.S. 2021
- Number of new, returning and lost fishing participants in the U.S. from 2007 to 2013
- Use of mobile technologies by fishing participants in the U.S. in 2013
- Annual outings of fly fishing participants in the U.S. 2021
- Ethnic distribution of fly fishing participants in the U.S. 2021
- Fishing participation rate South Korea 2019, by gender
- Gender distribution of freshwater fishing participants in the U.S. 2021
- Increase in online purchase intentions for sport & outdoor products in Italy 2021
US Fish and Wildlife Service. (December 15, 2017). Average spending of anglers on recreational fishing in the United States from 2001 to 2016 (in U.S. dollars) [Graph]. In Statista. Retrieved June 04, 2023, from https://www.statista.com/statistics/247235/average-angler-spendings-in-the-us/
US Fish and Wildlife Service. "Average spending of anglers on recreational fishing in the United States from 2001 to 2016 (in U.S. dollars)." Chart. December 15, 2017. Statista. Accessed June 04, 2023. https://www.statista.com/statistics/247235/average-angler-spendings-in-the-us/
US Fish and Wildlife Service. (2017). Average spending of anglers on recreational fishing in the United States from 2001 to 2016 (in U.S. dollars). Statista. Statista Inc.. Accessed: June 04, 2023. https://www.statista.com/statistics/247235/average-angler-spendings-in-the-us/
US Fish and Wildlife Service. "Average Spending of Anglers on Recreational Fishing in The United States from 2001 to 2016 (in U.S. Dollars)." Statista, Statista Inc., 15 Dec 2017, https://www.statista.com/statistics/247235/average-angler-spendings-in-the-us/
US Fish and Wildlife Service, Average spending of anglers on recreational fishing in the United States from 2001 to 2016 (in U.S. dollars) Statista, https://www.statista.com/statistics/247235/average-angler-spendings-in-the-us/ (last visited June 04, 2023)
Average spending of anglers on recreational fishing in the United States from 2001 to 2016 (in U.S. dollars) [Graph], US Fish and Wildlife Service, December 15, 2017. [Online]. Available: https://www.statista.com/statistics/247235/average-angler-spendings-in-the-us/