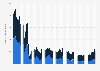
This statistic shows the share of total coupon redemption in the United States in 2011, by class of trade and product category. In 2011, 58.2 percent of total beverage coupon redemption in the United States occurred in conventional supermarkets.
Share of total coupon redemption in the United States in 2011, by class of trade and product category
Basic Account
Get to know the platform
You only have access to basic statistics.
Single Account
The ideal entry-level account for individual users
- Instant access to 1m statistics
- Download in XLS, PDF & PNG format
- Detailed references
$59 $39 / Month *
in the first 12 months
Corporate Account
Full access
Corporate solution including all features.
* Prices do not include sales tax.
Further Content: You might find this interesting as well
Statistics
- Share of total coupon redemption in the U.S. 2007-2011, by class of trade
- U.S. CPG market: coupon distribution by media type 2011-2014
- U.S. market: share of distributed coupons by face value 2007-2011
- U.S. CPG market: coupon face values distributed by sector 2009-2011
- Total value of distributed consumer packaged goods coupons in the U.S. 2007-2011
- Food grocery coupons: change in U.S. coupon distribution by segment 2013
- Total number of coupons redeemed in the U.S. 2005-2016
- Methods of coupon distribution in the U.S. 2016
- Methods of coupon redemption in the U.S. 2016
- Total number of coupons distributed in the U.S. 2011-2016
- Reasons for no further use of online couponing in China 2010
- Discount value of coupons in Germany 2020, by product group
- Number of operating coupon websites in China 2012
- Online payments of coupon users compared to non-users in China in 2010
- Canadian searching for deals prior to shopping 2017
- Door-drop coupon usage in the United Kingdom (UK) 2011-2014
- Usage of online coupons in China 2010
- Coupon website usage in the United Kingdom (UK) 2011-2014
- Barriers to sustainable food/beverage purchases in the UK 2021
Inmar. (October 16, 2012). Share of total coupon redemption in the United States in 2011, by class of trade and product category [Graph]. In Statista. Retrieved June 30, 2022, from https://www.statista.com/statistics/247252/share-of-us-coupon-redemption-by-class-of-trade-and-product-category/
Inmar. "Share of total coupon redemption in the United States in 2011, by class of trade and product category." Chart. October 16, 2012. Statista. Accessed June 30, 2022. https://www.statista.com/statistics/247252/share-of-us-coupon-redemption-by-class-of-trade-and-product-category/
Inmar. (2012). Share of total coupon redemption in the United States in 2011, by class of trade and product category. Statista. Statista Inc.. Accessed: June 30, 2022. https://www.statista.com/statistics/247252/share-of-us-coupon-redemption-by-class-of-trade-and-product-category/
Inmar. "Share of Total Coupon Redemption in The United States in 2011, by Class of Trade and Product Category." Statista, Statista Inc., 16 Oct 2012, https://www.statista.com/statistics/247252/share-of-us-coupon-redemption-by-class-of-trade-and-product-category/
Inmar, Share of total coupon redemption in the United States in 2011, by class of trade and product category Statista, https://www.statista.com/statistics/247252/share-of-us-coupon-redemption-by-class-of-trade-and-product-category/ (last visited June 30, 2022)