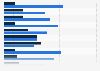
This statistic shows the distribution of persons aged 60 and older in urban and rural China in 2010, by type of housing. In 2010, around 5 percent of the elderly in rural China rented public housing.
Distribution of persons aged 60 and older in urban and rural China in 2010, by type of housing
Basic Account
Get to know the platform
You only have access to basic statistics.
This statistic is not included in your account.
Starter Account
The ideal entry-level account for individual users
- Instant access to 1m statistics
- Download in XLS, PDF & PNG format
- Detailed references
$199 USD / Month *
Professional Account
Full access
Business Solutions including all features.
* Prices do not include sales tax.
Other statistics that may interest you Statistics on
About the industry
10
- Premium Statistic Share of elderly in China willing to live in a care home 2006-2010
- Basic Statistic Scotland: local perception of neighborhood by urban rural classification 2018
- Premium Statistic Electricity household penetration in Peru 2009-2021, by area
- Basic Statistic Age-specific death rate of elderly people in rural and urban India 2020
- Basic Statistic Age-specific death rate of elderly people in India 2020, by gender
- Premium Statistic Number of beggars in India 2011, by age
- Premium Statistic Number of beggars and vagrants in India 2011, by state
- Premium Statistic Number of beggars and vagrants in India 2011, by gender
- Premium Statistic Labor force and employment in Zhengzhou, China 2019, by employment status
- Premium Statistic Labor force and employment in Lanzhou, China 2019, by employment status
About the region
10
- Premium Statistic Number of nursing homes for elderly people in China 2014-2022
- Premium Statistic Labor force and employment in Xi’an, China 2019, by employment status
- Premium Statistic Labor force and employment in Tangshan 2019, by employment status
- Premium Statistic Labor force and employment in Jinan 2019, by employment status
- Premium Statistic Labor force and employment in Urumqi, China 2019, by employment status
- Premium Statistic Labor force and employment in Taiyuan 2019, by category
- Premium Statistic Labor force and employment in Wuhan, China 2019, by employment status
- Premium Statistic Labor force and employment in Dalian 2019, by category
- Premium Statistic Labor force and employment in Changsha, China 2019, by employment status
- Premium Statistic Labor force and employment in Shenyang 2019, by employment status
Selected statistics
1
Other regions
10
- Basic Statistic Prevalence of nondrinking among U.S. adults in 2013, by urban-rural status
- Premium Statistic Share of convenience store types United Kingdom (UK) 2023
- Premium Statistic Labor force and employment in Hangzhou 2019, by employment status
- Premium Statistic Households with farm animals or livestock ownership in Ghana 2018, by area
- Basic Statistic French people willing to leave the city to live closer to nature 2019, by gender
- Basic Statistic Italy: unemployment figures by urban-rural typology in 2015
- Premium Statistic Share of pregnancy among teens in India - by age 2014
- Basic Statistic Internet usage frequency in Russia 2022, by area
- Premium Statistic Dwelling suitability for rented homes New Zealand 2019
- Premium Statistic Percentage of urban population exposed to air pollutants in the EU-27 2000-2021
Related statistics
10
- Premium Statistic Labor force and employment in Nanjing 2019, by employment status
- Premium Statistic Labor force and employment in Hefei 2019, by employment status
- Premium Statistic Labor force and employment in Nanchang, China 2019, by employment status
- Premium Statistic Labor force and employment in Guangzhou, China 2019, by employment status
- Premium Statistic Labor force and employment in Nanning, China 2019, by employment status
- Premium Statistic Labor force and employment in Chongqing, China 2019, by employment status
- Premium Statistic Labor force and employment in Beijing 2019, by category
- Premium Statistic Labor force and employment in Chengdu, China 2019, by employment status
- Premium Statistic Labor force and employment in Guiyang, China 2019, by employment status
- Premium Statistic Labor force and employment in Changchun 2019, by employment status
Further related statistics
9
- Internet user distribution in China 2012-2023, by urban and rural region
- Location of death among hospice patients in the U.S. 2018
- Private short-term rentals booked with Airbnb in New York City in 2010 and 2014
- Structure of investment portfolio of Allianz Group 2014-2023
- Number of CBRE Group employees 2009-2022
- Brazil: land area use share by type 2010-2020
- Extended stay lodging units: total number in the U.S. 2008-2016
- Size of U.S. hospices by number of admissions 2012-2014
- Preventive care and screenings taken by adults aged 65 or older 2010
Further Content: You might find this interesting as well
Statistics
- Internet user distribution in China 2012-2023, by urban and rural region
- Location of death among hospice patients in the U.S. 2018
- Private short-term rentals booked with Airbnb in New York City in 2010 and 2014
- Structure of investment portfolio of Allianz Group 2014-2023
- Number of CBRE Group employees 2009-2022
- Brazil: land area use share by type 2010-2020
- Extended stay lodging units: total number in the U.S. 2008-2016
- Size of U.S. hospices by number of admissions 2012-2014
- Preventive care and screenings taken by adults aged 65 or older 2010
People's Daily. (July 10, 2012). Distribution of persons aged 60 and older in urban and rural China in 2010, by type of housing [Graph]. In Statista. Retrieved April 19, 2024, from https://www.statista.com/statistics/251865/distribution-of-elderly-in-china-by-type-of-housing/
People's Daily. "Distribution of persons aged 60 and older in urban and rural China in 2010, by type of housing." Chart. July 10, 2012. Statista. Accessed April 19, 2024. https://www.statista.com/statistics/251865/distribution-of-elderly-in-china-by-type-of-housing/
People's Daily. (2012). Distribution of persons aged 60 and older in urban and rural China in 2010, by type of housing. Statista. Statista Inc.. Accessed: April 19, 2024. https://www.statista.com/statistics/251865/distribution-of-elderly-in-china-by-type-of-housing/
People's Daily. "Distribution of Persons Aged 60 and Older in Urban and Rural China in 2010, by Type of Housing." Statista, Statista Inc., 10 Jul 2012, https://www.statista.com/statistics/251865/distribution-of-elderly-in-china-by-type-of-housing/
People's Daily, Distribution of persons aged 60 and older in urban and rural China in 2010, by type of housing Statista, https://www.statista.com/statistics/251865/distribution-of-elderly-in-china-by-type-of-housing/ (last visited April 19, 2024)
Distribution of persons aged 60 and older in urban and rural China in 2010, by type of housing [Graph], People's Daily, July 10, 2012. [Online]. Available: https://www.statista.com/statistics/251865/distribution-of-elderly-in-china-by-type-of-housing/