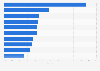
This statistic represents U.S. e-commerce revenue generated through auto and parts retail sales between 2012 and 2019. Figures from 2016 onwards are projections. In 2015, retail e-commerce revenue from auto and parts sales amounted to 36.1 billion U.S. dollars.
U.S. auto and parts e-commerce revenue from 2012 to 2019 (in billion U.S. dollars)
Basic Account
Get to know the platform
You only have access to basic statistics.
This statistic is not included in your account.
Starter Account
The ideal entry-level account for individual users
- Instant access to 1m statistics
- Download in XLS, PDF & PNG format
- Detailed references
$189 USD $149 USD / Month *
in the first 12 months
Professional Account
Full access
Business Solutions including all features.
* Prices do not include sales tax.
Other statistics that may interest you Statistics on
About the industry
10
- Premium Statistic Consumer electronics e-commerce market revenue in the U.S. 2017-2027
- Premium Statistic Revenue of the books, movies, music & games industry in the U.S. 2018-2027
- Premium Statistic Revenue of the personal care industry in the U.S. 2018-2027
- Premium Statistic Revenue of the e-commerce industry in the U.S. 2017-2027
- Basic Statistic Internet retail sales value change in Great Britain June 2023, by sector
- Basic Statistic Vehicle and auto equipment wholesale trade e-commerce sales in the U.S. 2007-2021
- Premium Statistic Retail e-commerce holiday season sales in the U.S. 2016-2022
- Premium Statistic CyberMonday sales revenue in Chile 2011-2022
- Premium Statistic E-commerce penetration of physical goods in Taiwan H1 2022, by category
- Premium Statistic B2C e-commerce sales in Chile 2010-2023
About the region
10
- Premium Statistic Revenue of the toys, hobby & DIY industry in the U.S. 2018-2027
- Premium Statistic Revenue growth of personal care in the U.S. 2018-2027
- Premium Statistic Revenue growth of the fashion industry in the U.S. 2018-2027
- Premium Statistic MercadoLibre number of employees 2016-2022, by country
- Premium Statistic U.S. food and beverage e-retail share 2017-2027
- Premium Statistic Popular product categories purchased by Amazon Prime Day shoppers in the U.S. 2023
- Premium Statistic Purchase intent of Amazon Prime Day shoppers in the U.S. 2023
- Premium Statistic Quarterly U.S. mobile e-commerce spending 2019-2022
- Basic Statistic U.S. books, movies, music & games e-retail share 2017-2025
- Premium Statistic U.S. toys, hobby & DIY e-retail share 2017-2025
Selected statistics
1
Other regions
10
- Premium Statistic Next plc: retail and online sales 2009-2023
- Premium Statistic Breakdown of beauty product sales on Singles' Day China 2021, by e-commerce platform
- Premium Statistic Middle East and North Africa: leading e-commerce markets 2015
- Premium Statistic Japan: leading e-commerce categories 2013, by sales
- Premium Statistic Number of registered sellers on Alibaba in Myanmar 2015-2017
- Premium Statistic Number of registered sellers on Alibaba in Bangladesh 2015-2017
- Premium Statistic Number of active buyers on Alibaba in Nepal 2015-2017
- Premium Statistic E-commerce sales share in total retail sales in Hong Kong 2016-2021
- Premium Statistic Online spending growth New Zealand 2018, by sector
- Premium Statistic Share of domestic and international online retail spend Australia 2017 by category
Related statistics
10
- Premium Statistic Leading e-commerce and shopping websites in Belgium 2023, based on visit share
- Premium Statistic Most visited e-commerce sites in Belgium 2022
- Premium Statistic Retail e-commerce sales value in Canada 2020-2026
- Premium Statistic Countries with the highest share of retail sales taking place online 2022
- Premium Statistic Shopping habits before Black Friday in Italy 2021
- Premium Statistic B2C e-commerce revenue growth in Denmark 2010-2021
- Premium Statistic Main challenges of B2B online sales in Denmark 2020
- Premium Statistic Usage of digital and offline channels for B2B sales in Denmark 2020
- Premium Statistic E-commerce vs. store-based share of global household & pet care sales 2015-2025
- Premium Statistic E-commerce sales growth in the U.S. 2013-2020
Further related statistics
8
- Leading online retailers in Southeast Asia 2020, by monthly visits
- Unique visitors to most popular online retailers in India 2014
- China: SAIC auto sales by type 2009-2021
- Consumer electronics: Online purchasing in Great Britain 2020, by demographic
- ICT Development Index rankings 2017, by country
- Use of smartphones by shoppers in retail stores in Italy in 2015
- Chinese insulin market distribution: leading companies 2011
- U.S. insulin market distribution: leading companies 2011
Further Content: You might find this interesting as well
Statistics
- Leading online retailers in Southeast Asia 2020, by monthly visits
- Unique visitors to most popular online retailers in India 2014
- China: SAIC auto sales by type 2009-2021
- Consumer electronics: Online purchasing in Great Britain 2020, by demographic
- ICT Development Index rankings 2017, by country
- Use of smartphones by shoppers in retail stores in Italy in 2015
- Chinese insulin market distribution: leading companies 2011
- U.S. insulin market distribution: leading companies 2011
Bloomberg. (January 28, 2016). U.S. auto and parts e-commerce revenue from 2012 to 2019 (in billion U.S. dollars) [Graph]. In Statista. Retrieved September 23, 2023, from https://www.statista.com/statistics/257520/us-auto-and-parts-e-commerce-revenue/
Bloomberg. "U.S. auto and parts e-commerce revenue from 2012 to 2019 (in billion U.S. dollars)." Chart. January 28, 2016. Statista. Accessed September 23, 2023. https://www.statista.com/statistics/257520/us-auto-and-parts-e-commerce-revenue/
Bloomberg. (2016). U.S. auto and parts e-commerce revenue from 2012 to 2019 (in billion U.S. dollars). Statista. Statista Inc.. Accessed: September 23, 2023. https://www.statista.com/statistics/257520/us-auto-and-parts-e-commerce-revenue/
Bloomberg. "U.S. Auto and Parts E-commerce Revenue from 2012 to 2019 (in Billion U.S. Dollars)." Statista, Statista Inc., 28 Jan 2016, https://www.statista.com/statistics/257520/us-auto-and-parts-e-commerce-revenue/
Bloomberg, U.S. auto and parts e-commerce revenue from 2012 to 2019 (in billion U.S. dollars) Statista, https://www.statista.com/statistics/257520/us-auto-and-parts-e-commerce-revenue/ (last visited September 23, 2023)
U.S. auto and parts e-commerce revenue from 2012 to 2019 (in billion U.S. dollars) [Graph], Bloomberg, January 28, 2016. [Online]. Available: https://www.statista.com/statistics/257520/us-auto-and-parts-e-commerce-revenue/