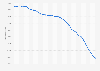
This statistic gives information on the social casino market size in Asia in 2012 with projections to 2015. In 2014, the social casino market in Asia is expected to generate 525 million U.S. dollars in revenues.
Social casino market size in Asia from 2012 to 2015 (in million U.S. dollars)
Basic Account
Get to know the platform
You only have access to basic statistics.
This statistic is not included in your account.
Starter Account
The ideal entry-level account for individual users
- Instant access to 1m statistics
- Download in XLS, PDF & PNG format
- Detailed references
$59 USD $39 USD / Month *
in the first 12 months
Professional Account
Full access
Corporate solution including all features.
* Prices do not include sales tax.
Statistics on Paid content in U.S. print and digital media
Global overview
8
- Premium Statistic Forecast of ePublishing revenue by segment in the World 2017-2025
- Premium Statistic Worldwide digital newspaper circulation revenue 2012-2018
- Premium Statistic Global digital newspaper advertising revenue 2013-2017
- Premium Statistic Forecast ePublishing users by segment in the World 2017-2025
- Premium Statistic Digital Market Outlook: e-publishing revenue in selected countries 2022
- Basic Statistic Digital news purchases worldwide 2022
- Premium Statistic Frequency of paying for online digital video worldwide 2017
- Premium Statistic Frequency of paying for online digital audio worldwide 2017
U.S. overview
8
- Premium Statistic Forecast of ePublishing revenue by segment in the United States 2017-2025
- Premium Statistic U.S. newspaper publishing revenue 2010-2021, by media type
- Premium Statistic U.S. periodical publishing revenue 2010-2021, by media type
- Basic Statistic Paid circulation of daily weekday newspapers in the U.S. 1985-2020
- Premium Statistic Paid circulation of Sunday newspapers in the U.S. 2000-2020
- Premium Statistic African American daily newspaper circulation in the U.S. 2014-2018
- Premium Statistic Popular publication types among newspaper subscribers in the U.S. 2017
- Premium Statistic Magazines with largest audience in the U.S. 2019
Canadian overview
5
- Premium Statistic Number of newspapers with paywalls in Canada 2012-2016
- Basic Statistic Canada total community newspaper circulation 2013-2021, by type
- Basic Statistic Canada: circulation of paid community newspapers 2013-2021, by province and territory
- Premium Statistic Canada: leading ways to access magazine content 2017
- Premium Statistic Canada: leading ways to access paid magazine content 2017
Digital subscriptions
8
- Premium Statistic Online subscriptions to news websites worldwide 2022
- Premium Statistic Digital-only newspaper subscriber share worldwide 2017
- Basic Statistic Average weekly costs of online newspaper subscriptions U.S. 2017
- Basic Statistic Consumers with a newspaper or magazine subscriptions in the U.S. 2017, by age group
- Basic Statistic New York Times Company: digital news subscribers Q1 2014-Q3 2022
- Premium Statistic Newspaper/magazine subscription payment method in the U.S. 2017, by age group
- Basic Statistic Likelihood of continuing newspaper subscription in the U.S. 2017, by age group
- Premium Statistic Consumption of paid online news content in the U.S. 2017-2019, by topic
Audiences
7
- Premium Statistic U.S. magazine audience 2015-2019 by platform
- Premium Statistic Forecast ePublishing users by segment in the United States 2017-2025
- Premium Statistic Digital Market Outlook: readers of e-publishing formats in the U.S. 2017-2027
- Premium Statistic Consumption of paid online editorial content in the U.S. 2017-2019, by gender
- Premium Statistic Consumption of paid online editorial content in the U.S. 2017, by age
- Premium Statistic U.S. internet magazine audience 2015-2019
- Premium Statistic U.S. mobile web magazine audience 2015-2019
Consumer preferences & behavior
7
- Premium Statistic Devices used for reading online news in the U.S. 2013-2022
- Basic Statistic Digital news purchases worldwide 2022
- Premium Statistic Digital/print news subscriptions in the U.S. in 2017, by length
- Premium Statistic Frequency of reading digital newspapers by U.S. consumers 2017, by gender
- Premium Statistic Frequency of reading digital newspapers by U.S. consumers 2017, by age group
- Premium Statistic Frequency of reading digital magazines by U.S. consumers 2017, by gender
- Premium Statistic Frequency of reading digital magazines by U.S. consumers 2017, by age group
Further related statistics
15
- Social casino market size in France 2012-2015
- Social casino market size in Europe 2012-2015
- Social casino market size in Latin America 2012-2015
- Social casino market size in Germany 2012-2015
- SciPlay average MAU 2019-2021
- Social gaming: average revenue per paying user in the U.S. 2011-2012
- King's gross bookings as of 4th quarter 2013, by region
- King segment operating profit as of Q2 2022
- King annual net income 2010-2015
- Facebook most popular game DAU 2019
- DoubleDown Interactive average MAU 2019-2021
- Distribution of U.S. social casino gamers as of August 2016, by age and gender
- Global social casino revenues 2014-2026
- Reasons to be a paid user of dating platforms in China 2021
- Average monthly carrier billing transaction value in Pakistan 2020-2021
Further Content: You might find this interesting as well
Statistics
- Social casino market size in France 2012-2015
- Social casino market size in Europe 2012-2015
- Social casino market size in Latin America 2012-2015
- Social casino market size in Germany 2012-2015
- SciPlay average MAU 2019-2021
- Social gaming: average revenue per paying user in the U.S. 2011-2012
- King's gross bookings as of 4th quarter 2013, by region
- King segment operating profit as of Q2 2022
- King annual net income 2010-2015
- Facebook most popular game DAU 2019
- DoubleDown Interactive average MAU 2019-2021
- Distribution of U.S. social casino gamers as of August 2016, by age and gender
- Global social casino revenues 2014-2026
- Reasons to be a paid user of dating platforms in China 2021
- Average monthly carrier billing transaction value in Pakistan 2020-2021
SuperData Research. (April 3, 2013). Social casino market size in Asia from 2012 to 2015 (in million U.S. dollars) [Graph]. In Statista. Retrieved January 27, 2023, from https://www.statista.com/statistics/259876/social-casino-market-size-in-asia/
SuperData Research. "Social casino market size in Asia from 2012 to 2015 (in million U.S. dollars)." Chart. April 3, 2013. Statista. Accessed January 27, 2023. https://www.statista.com/statistics/259876/social-casino-market-size-in-asia/
SuperData Research. (2013). Social casino market size in Asia from 2012 to 2015 (in million U.S. dollars). Statista. Statista Inc.. Accessed: January 27, 2023. https://www.statista.com/statistics/259876/social-casino-market-size-in-asia/
SuperData Research. "Social Casino Market Size in Asia from 2012 to 2015 (in Million U.S. Dollars)." Statista, Statista Inc., 3 Apr 2013, https://www.statista.com/statistics/259876/social-casino-market-size-in-asia/
SuperData Research, Social casino market size in Asia from 2012 to 2015 (in million U.S. dollars) Statista, https://www.statista.com/statistics/259876/social-casino-market-size-in-asia/ (last visited January 27, 2023)
Social casino market size in Asia from 2012 to 2015 (in million U.S. dollars) [Graph], SuperData Research, April 3, 2013. [Online]. Available: https://www.statista.com/statistics/259876/social-casino-market-size-in-asia/