- Transportation & Logistics›
- Water Transport›
Revenue of A.P. Møller - Maersk A/S - Svitzer 2011
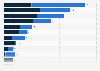
Revenue of Svitzer in 2010 and 2011 (in million U.S. dollars)

Revenue of Svitzer in 2010 and 2011 (in million U.S. dollars)
Revenue in million U.S. dollars | |
---|---|
2010 | 890 |
2011 | 992 |
Revenue in million U.S. dollars | |
---|---|
2010 | 890 |
2011 | 992 |
© Statista 2019
About this statistic
Show source
Please be patient - this may take a moment
Description
Source
More information
- Show sources information
- Show publisher information
- Release date
- February 2012
- Region
- Worldwide
- Survey time period
- 2010 to 2011
Source
- Show sources information
- Show publisher information
- Release date
- February 2012
More information
- Region
- Worldwide
- Survey time period
- 2010 to 2011
Other statistics on the topic
You only have access to basic statistics.
- Instant access to 1m statistics
- Download in XLS, PDF & PNG format
- Detailed references
$59 / Month *
Corporate solution including all features.
Prices do not include sales tax.


Statista is a great source of knowledge, and pretty helpful to manage the daily work.Christof Baron
CEO, MindShare Germany
- Market overview
- Projected cold chain logistics spending, transport and packaging from 2016 to 2022, by region (in billion U.S. dollars)Cold chain logistics spending, transport and packaging by region 2016-2022
- Projected cold chain logistics spending in 2018, by mode of transport (in billion U.S. dollars)Cold chain logistics spending by mode of transport 2018
- Global capacity of refrigerated warehouses from 2014 to 2018 (in million cubic meters)Global capacity of refrigerated warehouses 2014-2018
- Leading refrigerated warehousing and logistics providers worldwide in 2019, by capacity of temperature-controlled space (in million cubic meters)Leading providers in the world of temperature-controlled warehouse space 2019
- Market share of the leading temperature-controlled companies worldwide as of August 2019*Global market share of leading temperature-controlled companies 2019
- Americold Logistics' net revenue worldwide from 2013 to 2018 (in million U.S. dollars)Net revenue of Americold Logistics 2013-2018
- Leading temperature-controlled carriers in the United States in 2018, by revenue (in million U.S. dollars)Revenue of the largest temperature-controlled carriers in U.S. 2018
- Food industry
- Frozen food sales in the United States in 2018, by product category (in million U.S. dollars)Frozen food market: sales in the U.S. 2018, by product category
- Global third-party logistics revenue earned in the food and groceries market from 2008 to 2018 (in billion U.S. dollars)*3PL revenue in the food and grocery market 2008-2018
- Volume of frozen food in cold storage in the United States in 2018, by category (in million pounds)Cold storage frozen food volume in the U.S. by category 2018
- Volume of frozen fruits in cold storage in the United States in 2018, by type (in million pounds)Cold storage frozen fruits volume in the U.S. by type 2018
- Pharmaceutical industry
- Global pharmaceutical air trade in 2000 and 2016, by weight (in 1,000 metric tons)Weight of the pharmaceutical air trade worldwide 2000-2016
- Global pharmaceutical ocean trade in 2000 and 2016, by weight (in 1,000 metric tons)Weight of the pharmaceutical shipping trade worldwide 2000-2016
- Leading exporting countries in the pharma air trade from January to August 2017, by weight (in 1,000 metric tons)Air trade of pharmaceuticals by export country January-August 2017
- Leading importing countries in the pharma air trade from January to August 2017, by weight (in 1,000 metric tons)Air trade of pharmaceuticals by importing country January-August 2017
- Global biopharma cold chain product sales from 2016 to 2023 (in billion U.S. dollars)Global biopharma cold chain product sales 2016-2023
- Projected biopharma cold chain logistics spending from 2016 to 2022 (in billion U.S. dollars)Global biopharma cold chain logistics spending 2016-2022
- Biopharma non-cold chain logistics spending from 2016 to 2022 (in billion U.S. dollars)Global biopharma non-cold chain logistics spending trend 2016-2022
- U.S. cold chain logistics market
- Revenue of U.S. temperature-controlled warehouse industry from 2006 to 2018 (in million U.S. dollars)Revenue of U.S. temperature-controlled warehouses 2006-2018
- Market share of the leading U.S. temperature-controlled companies as of August 2019*U.S. market share of leading temperature-controlled companies 2019
- Capacity of refrigerated warehouses in the NAFTA region from 2014 to 2018 (in million cubic meters)*Capacity of refrigerated warehouses in NAFTA 2014-2018
- Major refrigerated warehousing and logistics providers in North America in 2019, by capacity of temperature-controlled space (in thousand cubic meters)Leading North American providers of temperature-controlled warehouse space 2019
- Gross refrigerated storage capacity in the United States from 1997 to 2017 (in billion cubic feet)*Gross capacity of refrigerated warehouses in U.S. 1997-2017
- Leading states with the largest gross refrigerated warehouse capacity in the United States in 2017 (in million cubic feet)Gross capacity of refrigerated warehouses of the leading U.S. states 2017
- Warehouse revenue generated by Americold Logistics in the United States in 2018, by region (in million U.S. dollars)Americold Logistics: U.S. warehouse revenue by region 2018
- Americold Logistics's warehouse capacity in the United States in 2018, by region (in million cubic feet)Americold Logistics: U.S. warehouse capacity by region 2018
- Revenue of A.P. Møller - Mærsk A/S - Maersk Supply Service 2011
- Revenue of AP Møller Mærsk AS Tankers 2012
- Moeller-Maersk's EBIT 2009-2018
- Moeller-Maersk's year-end market capitalization 2009-2018
- Maersk - invested capital by segment 2017
- Moeller-Maersk's assets 2009-2018
- U.S. exports carried by vessel - value by target country 2011
- Cellular container ship fleet - worldwide capacity 2007-2012
- World container ship fleet - Size
- Container shipping - companies' profits 2011
- Oceangoing privately owned barges by type under U.S.-flag 2015
- Merchant container ship fleet size of selected regions 1996-2018
- Port of Hamburg, Germany - container handling with North America 2014
- Container ships - number by size
- Container vessels - number of container ships 2008-2013
- Container fleet - global capacity trend 2007-2019
- World seaborne and container trade - value 2010
- Scrapped vessels by type - worldwide volume 2016
- Cold chain logistics spending, transport and packaging by region 2016-2022
- Cold chain logistics spending by mode of transport 2018
- Global capacity of refrigerated warehouses 2014-2018
- Leading providers in the world of temperature-controlled warehouse space 2019
- Global market share of leading temperature-controlled companies 2019
- Net revenue of Americold Logistics 2013-2018
- Revenue of the largest temperature-controlled carriers in U.S. 2018
- Weight of the pharmaceutical air trade worldwide 2000-2016
- Weight of the pharmaceutical shipping trade worldwide 2000-2016
- Air trade of pharmaceuticals by export country January-August 2017
- Air trade of pharmaceuticals by importing country January-August 2017
- Global biopharma cold chain product sales 2016-2023
- Global biopharma cold chain logistics spending 2016-2022
- Global biopharma non-cold chain logistics spending trend 2016-2022
- Revenue of U.S. temperature-controlled warehouses 2006-2018
- U.S. market share of leading temperature-controlled companies 2019
- Capacity of refrigerated warehouses in NAFTA 2014-2018
- Leading North American providers of temperature-controlled warehouse space 2019
- Gross capacity of refrigerated warehouses in U.S. 1997-2017
- Gross capacity of refrigerated warehouses of the leading U.S. states 2017
- Americold Logistics: U.S. warehouse revenue by region 2018
- Americold Logistics: U.S. warehouse capacity by region 2018
- Revenue of A.P. Møller - Mærsk A/S - Maersk Supply Service 2011
- Revenue of AP Møller Mærsk AS Tankers 2012
- Moeller-Maersk's EBIT 2009-2018
- Moeller-Maersk's year-end market capitalization 2009-2018
- Maersk - invested capital by segment 2017
- Moeller-Maersk's assets 2009-2018
- U.S. exports carried by vessel - value by target country 2011
- Cellular container ship fleet - worldwide capacity 2007-2012
- World container ship fleet - Size
- Container shipping - companies' profits 2011
- Oceangoing privately owned barges by type under U.S.-flag 2015
- Merchant container ship fleet size of selected regions 1996-2018
- Port of Hamburg, Germany - container handling with North America 2014
- Container ships - number by size
- Container vessels - number of container ships 2008-2013
- Container fleet - global capacity trend 2007-2019
- World seaborne and container trade - value 2010
- Scrapped vessels by type - worldwide volume 2016
Statista offers dossiers and reports on over 170 industries. With Statista you are always able to make informed decisions and boost your work efficiency.
- Social Media
- E-Commerce
- Online Video & Entertainment
- Advertising & Marketing
- Alcoholic Beverages
- Cleaning Products
- Cosmetics & Personal Care
- Food & Nutrition
- Health & Hygiene
- International Trade
- Shopping Behavior
- Sports & Leisure
- Business Travel
- Leisure Travel
- Accomodation
- Restaurants
- Demographics
- Economy
- Education & Science
- Politics & Government
- Aviation
- Rail Transport
- Vehicles & Road Traffic
- Water Transport
Register in seconds and access exclusive features.
Basic Account
|
Instant Access
Premium Account
| ||
---|---|---|---|
Our services
Click the question mark for further information | Free |
$59 per month*
| |
Basic statistics | |||
Premium statistics | |||
Graph download
| |||
Download PDF | |||
Excel download
| |||
Register | Purchase now |
This feature is limited to our corporate solutions.
Please contact us to get started with full access to dossiers, forecasts, studies and international data.
We use cookies to personalize contents and ads, offer social media features, and analyze access to our website. In your browser settings you can configure or disable this, respectively, and can delete any already placed cookies. For details, please see your browser’s Help section (by pressing F1). Please see our privacy statement for details about how we use data.