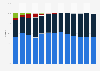
3D-ready mobile phones in Japan from 2010 to 2015
According to forecasts, the penetration rate of 3D-ready mobile phones in Japan will be between one and three percent in 2011.
You only have access to basic statistics.
This statistic is not included in your account.
Business Solutions including all features.
About the industry
About the region
Selected statistics
Other regions
Related statistics
Further related statistics