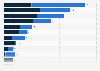
This statistic shows selected key figures of Hamburg Süd for 2010 and 2011. The company generated a revenue of 4.43 billion euros in 2010.
Selected Key figures of Hamburg Süd in 2010 and 2011
Basic Account
Get to know the platform
You only have access to basic statistics.
Starter Account
The ideal entry-level account for individual users
- Instant access to 1m statistics
- Download in XLS, PDF & PNG format
- Detailed references
$199 USD / Month *
Professional Account
Full access
Business Solutions including all features.
* Prices do not include sales tax.
Other statistics that may interest you Statistics on
About the industry
10
- Basic Statistic Container shipping companies worldwide - number of ships 2022
- Basic Statistic Hanjin Shipping - number of TEUs 2016
- Premium Statistic Number of orderbook ships of the leading container ship operators 2024
- Premium Statistic Leading container ship operators - owned and chartered TEUs 2024
- Premium Statistic Hapag-Lloyd's GHG emissions 2017-2023
- Premium Statistic Moeller-Maersk's energy consumption by source 2017-2022
- Premium Statistic Moeller-Maersk's assets 2018-2022
- Premium Statistic Moeller-Maersk's year-end market capitalization 2009-2022
- Premium Statistic Maersk - Ocean revenue 2017-2022
- Premium Statistic Moeller-Maersk's GHG emissions 2017-2022, by scope
About the region
10
- Premium Statistic Cellular container ship fleet - worldwide capacity 2007-2012
- Premium Statistic Scrapped vessels by type - worldwide volume 2016
- Basic Statistic Hamburg Süd revenue by segment 2013-2014
- Basic Statistic AP Møller Maersk - segment revenue 2022
- Premium Statistic Scrapped container ships worldwide 2014-2020
- Premium Statistic Container terminal companies - global market cap as of June 2015
- Basic Statistic Hamburg Sud - number of container ships 2014
- Basic Statistic Container shipping - companies' profits 2011
- Premium Statistic EBIT margin of selected container lines 2020-2023
- Premium Statistic Largest container ports worldwide based on throughput 2022
Other regions
10
- Premium Statistic Leading seaports for container handling in China 2021
- Premium Statistic Mexico: container port cargo throughput 2012-2019
- Premium Statistic Colombia: container cargo throughput Cartagena Bay 2012-2021
- Premium Statistic Shipbreaking - capacity
- Premium Statistic Average age of container-carrying ships in APAC 2018, by country
- Premium Statistic Container freight volume traded with Italy 2018, by carrier nationality
- Premium Statistic Number of loaded containers in Swedish ports with and without cargo 2015-2019
- Premium Statistic Puerto Rico: container port cargo throughput 2012-2019
- Premium Statistic Dominican Republic: container port cargo throughput 2012-2019
- Premium Statistic Argentina: container port cargo throughput 2012-2019
Related statistics
10
- Premium Statistic Brazil: container cargo throughput port of Santos 2012-2021
- Premium Statistic Panama: container cargo throughput port of Colón 2012-2021
- Premium Statistic Panama: container cargo throughput port of Balboa 2012-2021
- Premium Statistic Capacity of container ships in seaborne trade 1980-2023
- Premium Statistic Size of container ship fleet 2022, by nationality of operator
- Premium Statistic Latin America: largest container ports by container traffic 2021
- Premium Statistic COSCO SHIPPING Lines' fuel oil consumption 2017-2021
- Premium Statistic COSCO SHIPPING Lines GHG emissions 2018-2022
- Premium Statistic Throughput of containers handled in major ports in Denmark 2021
- Basic Statistic Leading container ship operators based on TEU capacity of own ships 2022
Further Content: You might find this interesting as well
Hamburg Süd-Gruppe. (April 2, 2012). Selected Key figures of Hamburg Süd in 2010 and 2011 [Graph]. In Statista. Retrieved April 24, 2024, from https://www.statista.com/statistics/272867/selected-hamburg-sued-key-figures/
Hamburg Süd-Gruppe. "Selected Key figures of Hamburg Süd in 2010 and 2011." Chart. April 2, 2012. Statista. Accessed April 24, 2024. https://www.statista.com/statistics/272867/selected-hamburg-sued-key-figures/
Hamburg Süd-Gruppe. (2012). Selected Key figures of Hamburg Süd in 2010 and 2011. Statista. Statista Inc.. Accessed: April 24, 2024. https://www.statista.com/statistics/272867/selected-hamburg-sued-key-figures/
Hamburg Süd-Gruppe. "Selected Key Figures of Hamburg Süd in 2010 and 2011." Statista, Statista Inc., 2 Apr 2012, https://www.statista.com/statistics/272867/selected-hamburg-sued-key-figures/
Hamburg Süd-Gruppe, Selected Key figures of Hamburg Süd in 2010 and 2011 Statista, https://www.statista.com/statistics/272867/selected-hamburg-sued-key-figures/ (last visited April 24, 2024)
Selected Key figures of Hamburg Süd in 2010 and 2011 [Graph], Hamburg Süd-Gruppe, April 2, 2012. [Online]. Available: https://www.statista.com/statistics/272867/selected-hamburg-sued-key-figures/