Global revenue of Groupon from 2008 to 2022 (in million U.S. dollars)
Loading statistic...
Basic Account
Get to know the platform
You only have access to basic statistics.
Starter Account
The ideal entry-level account for individual users
- Instant access to 1m statistics
- Download in XLS, PDF & PNG format
- Detailed references
$199 USD / Month *
Professional Account
Full access
Business Solutions including all features.
* Prices do not include sales tax.
Other statistics that may interest you Groupon
Overview
6
- Basic Statistic 
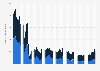
Groupon: global revenue 2008-2022
- Premium Statistic Groupon: quarterly revenue 2009-2023
- Premium Statistic Groupon: annual revenue in North America 2009-2022
- Premium Statistic Leading coupons and rebates websites worldwide 2023, based on visit share
- Premium Statistic Leading coupons and rebates websites in the U.S. 2023, based on visit share
- Premium Statistic Most visited coupon websites in the U.S. 2021-2022
Financials
7
- Premium Statistic Groupon market cap development 2011-2023
- Basic Statistic Groupon: annual net income/loss 2009-2022
- Basic Statistic Groupon: quarterly net income/loss 2015-2023
- Premium Statistic Groupon: quarterly gross billings 2014-2023, by category
- Premium Statistic Groupon: marketing expense 2013-2022
- Premium Statistic Groupon: operating expenses 2008-2022
- Basic Statistic Groupon: global sales force 2009-2023
Consumption
5
- Premium Statistic Number of Groupon active customers 2009-2023
- Premium Statistic Groupon mobile shoppers share in the U.S. 2023, by income
- Premium Statistic Sources of inspiration for new products in the U.S. 2023
- Premium Statistic Sources of information about products in the U.S. 2023
- Premium Statistic Shoppers who have used digital and paper coupons in the U.S. 2022, by generation
Online traffic
7
- Premium Statistic Groupon.com: key figures 2023
- Premium Statistic Total global visitor traffic to Groupon.com 2023
- Premium Statistic Groupon.com: website traffic share in the U.S. 2023, by device
- Premium Statistic Groupon app monthly downloads worldwide 2019-2023, by operating system
- Premium Statistic Countries with most Groupon app downloads 2022
- Premium Statistic Leading discount and offer apps worldwide 2022, by downloads
- Premium Statistic Leading discount and offer apps in the U.S. 2023, by downloads
Further related statistics
9
- Share of internet users who visited Groupon in the U.S. 2018, by age
- Total number of coupons distributed in the U.S. 2011-2016
- Share of U.S. coupon redemption 2011, by class of trade and product category
- Shoppers checking for grocery coupons and promotions in Europe 2015, by country
- Usage of coupons sent via post in the United Kingdom (UK) 2011-2014
- Food grocery coupons: change in U.S. coupon distribution by segment 2013
- Coupon website usage in the United Kingdom (UK) 2011-2014
- Leading e-commerce delivery methods in Chile 2022
- Brazil: Net Promoter Score of e-tailer Americanas.com 2016-2017
Further Content: You might find this interesting as well
Statistics
- Share of internet users who visited Groupon in the U.S. 2018, by age
- Total number of coupons distributed in the U.S. 2011-2016
- Share of U.S. coupon redemption 2011, by class of trade and product category
- Shoppers checking for grocery coupons and promotions in Europe 2015, by country
- Usage of coupons sent via post in the United Kingdom (UK) 2011-2014
- Food grocery coupons: change in U.S. coupon distribution by segment 2013
- Coupon website usage in the United Kingdom (UK) 2011-2014
- Leading e-commerce delivery methods in Chile 2022
- Brazil: Net Promoter Score of e-tailer Americanas.com 2016-2017
Groupon. (March 16, 2023). Global revenue of Groupon from 2008 to 2022 (in million U.S. dollars) [Graph]. In Statista. Retrieved April 23, 2024, from https://www.statista.com/statistics/273251/groupons-annual-global-revenue/
Groupon. "Global revenue of Groupon from 2008 to 2022 (in million U.S. dollars)." Chart. March 16, 2023. Statista. Accessed April 23, 2024. https://www.statista.com/statistics/273251/groupons-annual-global-revenue/
Groupon. (2023). Global revenue of Groupon from 2008 to 2022 (in million U.S. dollars). Statista. Statista Inc.. Accessed: April 23, 2024. https://www.statista.com/statistics/273251/groupons-annual-global-revenue/
Groupon. "Global Revenue of Groupon from 2008 to 2022 (in Million U.S. Dollars)." Statista, Statista Inc., 16 Mar 2023, https://www.statista.com/statistics/273251/groupons-annual-global-revenue/
Groupon, Global revenue of Groupon from 2008 to 2022 (in million U.S. dollars) Statista, https://www.statista.com/statistics/273251/groupons-annual-global-revenue/ (last visited April 23, 2024)
Global revenue of Groupon from 2008 to 2022 (in million U.S. dollars) [Graph], Groupon, March 16, 2023. [Online]. Available: https://www.statista.com/statistics/273251/groupons-annual-global-revenue/