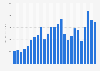
The statistic shows the distribution of the workforce across economic sectors in China from 2012 to 2022. In 2022, around 345.83 million people were employed in the service sector.
Breakdown of the workforce across economic sectors in China from 2012 to 2022 (in millions)
Loading statistic...
Basic Account
Get to know the platform
You only have access to basic statistics.
Starter Account
The ideal entry-level account for individual users
- Instant access to 1m statistics
- Download in XLS, PDF & PNG format
- Detailed references
$149 USD / Month *
Professional Account
Full access
Business Solutions including all features.
* Prices do not include sales tax.
Other statistics that may interest you Statistics on
About the industry
10
- Basic Statistic Distribution of the workforce across economic sectors in China 2012-2022
- Premium Statistic Share of female employment in agriculture in Morocco 2010-2019
- Premium Statistic Share of male employment in agriculture in Morocco 2010-2019
- Premium Statistic Distribution of migrant workers in China 2012-2022, by economic sector
- Premium Statistic Share of employed population in Morocco 2022, by economic activity and area
- Premium Statistic Number of farmers in the UK 2021-2023
- Premium Statistic Number of professional gardeners and landscape gardeners in the UK 2021-2023
- Premium Statistic Number of groundsmen and greenkeepers in the UK 2021-2023
- Basic Statistic Employment in Italy 2020, by economic sector
- Basic Statistic Employment by economic sector in Italy 2019-2020
About the region
10
- Premium Statistic Distribution of the workforce across economic sectors in Beijing 2011-2021
- Premium Statistic Employment in urban units in China 2021, by industry
- Premium Statistic Employment in urban units in China 2021, by region
- Premium Statistic Employment in urban private units and self-employment in China 2019, by industry
- Premium Statistic Employment in urban private units and self-employment in China 2019, by region
- Premium Statistic Nitrogen fertilizer production in China 1990-2021
- Premium Statistic Chemical pesticide production in China 1990-2021
- Premium Statistic Monthly soybean imports in China 2022-2023
- Premium Statistic Monthly rice imports in China 2022-2023
- Premium Statistic Monthly wheat imports in China 2022-2023
Selected statistics
6
- Basic Statistic Work/study situation of recent graduates in the U.S. 2012
- Premium Statistic Employer recruitment strategies for business school graduates in 2012
- Premium Statistic Skills and qualities considered by recruiters of business school graduates 2011
- Premium Statistic Workforce of not-for-profit theaters in the U.S. 2009-2021
- Premium Statistic Reasons for U.S. employers to implement employee/family assistance initiatives 2014
- Basic Statistic U.S. university graduates median starting salaries 2012, various categories
Other regions
10
- Basic Statistic Distribution of the workforce across economic sectors in France 2021
- Basic Statistic Distribution of the workforce across economic sectors in the United Kingdom 2021
- Basic Statistic Distribution of the workforce across economic sectors in the United States 2021
- Basic Statistic Distribution of the workforce across economic sectors in the Netherlands 2021
- Basic Statistic Economic sector distribution of the workforce in Japan 2021
- Basic Statistic Employment by economic sector in Latin America and the Caribbean 2021
- Basic Statistic Distribution of gross domestic product (GDP) across economic sectors Belarus 2022
- Basic Statistic Distribution of gross domestic product (GDP) across economic sectors Paraguay 2022
- Basic Statistic Distribution of gross domestic product (GDP) across economic sectors Moldova 2022
- Basic Statistic Distribution of gross domestic product (GDP) across economic sectors Mozambique 2021
Related statistics
10
- Premium Statistic Cultural and creative industries employment share Hong Kong 2011-2021
- Premium Statistic Wheat acreage in China 2012-2022
- Premium Statistic Acreage of oleiferous plants in China 2012-2022
- Premium Statistic Cotton acreage in China 2012-2022
- Premium Statistic Acreage of rice in China 2012-2022
- Premium Statistic Oleiferous plant production in China 2012-2022
- Premium Statistic Grain crop production volume in China 2012-2022, by major crop
- Premium Statistic Egg production in China 2012-2022
- Premium Statistic Cotton yield in China 2000-2021
- Premium Statistic Cereal yield in China 2000-2021
Further related statistics
10
- Number of CBRE Group employees 2009-2022
- AGCO's number of employees 2006-2021
- Number of food-preparation workers in the restaurant industry in the U.S. 2010-2026
- Number of bartenders employed in the restaurant industry in the U.S. 2010-2026
- Number of waiters and waitresses in the restaurant industry in the U.S. 2010-2026
- U.S. total apple production 2000-2022
- BayWa's revenue by segment 2010-2022
- Total U.S. domestic grain use 2001-2023
- Main employment centers of HSBC in 2022, by number of employees
- Corn for grain production in the U.S. 2001-2022
Further Content: You might find this interesting as well
Statistics
- Number of CBRE Group employees 2009-2022
- AGCO's number of employees 2006-2021
- Number of food-preparation workers in the restaurant industry in the U.S. 2010-2026
- Number of bartenders employed in the restaurant industry in the U.S. 2010-2026
- Number of waiters and waitresses in the restaurant industry in the U.S. 2010-2026
- U.S. total apple production 2000-2022
- BayWa's revenue by segment 2010-2022
- Total U.S. domestic grain use 2001-2023
- Main employment centers of HSBC in 2022, by number of employees
- Corn for grain production in the U.S. 2001-2022
National Bureau of Statistics of China. (October 16, 2023). Breakdown of the workforce across economic sectors in China from 2012 to 2022 (in millions) [Graph]. In Statista. Retrieved December 02, 2023, from https://www.statista.com/statistics/278346/economic-sector-distribution-of-the-workforce-in-china/
National Bureau of Statistics of China. "Breakdown of the workforce across economic sectors in China from 2012 to 2022 (in millions)." Chart. October 16, 2023. Statista. Accessed December 02, 2023. https://www.statista.com/statistics/278346/economic-sector-distribution-of-the-workforce-in-china/
National Bureau of Statistics of China. (2023). Breakdown of the workforce across economic sectors in China from 2012 to 2022 (in millions). Statista. Statista Inc.. Accessed: December 02, 2023. https://www.statista.com/statistics/278346/economic-sector-distribution-of-the-workforce-in-china/
National Bureau of Statistics of China. "Breakdown of The Workforce across Economic Sectors in China from 2012 to 2022 (in Millions)." Statista, Statista Inc., 16 Oct 2023, https://www.statista.com/statistics/278346/economic-sector-distribution-of-the-workforce-in-china/
National Bureau of Statistics of China, Breakdown of the workforce across economic sectors in China from 2012 to 2022 (in millions) Statista, https://www.statista.com/statistics/278346/economic-sector-distribution-of-the-workforce-in-china/ (last visited December 02, 2023)
Breakdown of the workforce across economic sectors in China from 2012 to 2022 (in millions) [Graph], National Bureau of Statistics of China, October 16, 2023. [Online]. Available: https://www.statista.com/statistics/278346/economic-sector-distribution-of-the-workforce-in-china/