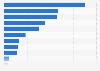
In 2020, approximately 10 million tons of refined copper were produced in China, a slight increase in comparison to the previous year. This figure also represents the peak in refined copper production in China in the period of consideration.
Production of refined copper in China between 2010 and 2020 (in million tons)
Basic Account
Get to know the platform
You only have access to basic statistics.
This statistic is not included in your account.
Starter Account
The ideal entry-level account for individual users
- Instant access to 1m statistics
- Download in XLS, PDF & PNG format
- Detailed references
$59 USD $39 USD / Month *
in the first 12 months
Professional Account
Full access
Corporate solution including all features.
* Prices do not include sales tax.
Statistics on Precious metals worldwide
Overview
8
- Premium Statistic Leading gold producing companies worldwide 2021
- Premium Statistic Leading silver producing companies worldwide 2021
- Premium Statistic Global leading platinum producing companies 2019
- Premium Statistic Leading palladium producing companies 2018
- Premium Statistic Global mine reserves of gold 2010-2021
- Premium Statistic World mine reserves of gold by country 2021
- Basic Statistic Silver reserves worldwide 2010-2021
- Premium Statistic Silver reserves worldwide by country 2021
Segments
8
- Premium Statistic Global production of gold mines 2010-2021
- Premium Statistic Gold production ranked by major countries 2021
- Premium Statistic Global silver mine production 2005-2021
- Premium Statistic Silver production in major countries worldwide 2021
- Premium Statistic Global platinum mine production by country 2021
- Basic Statistic Palladium mine production worldwide by country 2021
- Premium Statistic Silver demand worldwide by end use 2021
- Premium Statistic Gold demand volume worldwide by sector 2021
Companies
8
- Basic Statistic Newmont Corporation's revenue 2010-2021
- Basic Statistic Gold production of Newmont Corporation 2010-2021
- Basic Statistic Newmont Corporation's average realized gold price 2010-2021
- Basic Statistic Revenue of Fresnillo 2010-2021
- Basic Statistic Annual silver production of Fresnillo 2010-2021
- Premium Statistic Anglo American Platinum's revenue 2011-2021
- Basic Statistic Anglo American Platinum's production of platinum 2012-2021
- Premium Statistic Norilsk Nickel's annual revenue 2010-2021
Special focus: Precious metal prices
5
Further related statistics
11
- Copper scrap - global recycling input rate 2004-2014
- Aurubis AG's revenue 2003-2021
- South African copper production volume 2011-2018
- Export value of unwrought copper and copper products in China 2009-2020
- Export value of rolled copper from China 2009-2019
- Import value of copper ore in China 2009-2019
- Aurubis - number of employees 2009-2021
- Global leading copper mines based on output 2021
- Import volume of rolled copper to China 2009-2019
- Global refined copper demand growth 2015-2021
- Industry revenue of “copper rolling, drawing, extruding and alloying“ in Ohio 2012-2024
Further Content: You might find this interesting as well
Statistics
- Copper scrap - global recycling input rate 2004-2014
- Aurubis AG's revenue 2003-2021
- South African copper production volume 2011-2018
- Export value of unwrought copper and copper products in China 2009-2020
- Export value of rolled copper from China 2009-2019
- Import value of copper ore in China 2009-2019
- Aurubis - number of employees 2009-2021
- Global leading copper mines based on output 2021
- Import volume of rolled copper to China 2009-2019
- Global refined copper demand growth 2015-2021
- Industry revenue of “copper rolling, drawing, extruding and alloying“ in Ohio 2012-2024
National Bureau of Statistics of China. (October 9, 2021). Production of refined copper in China between 2010 and 2020 (in million tons) [Graph]. In Statista. Retrieved January 28, 2023, from https://www.statista.com/statistics/279224/production-of-refined-copper-in-china/
National Bureau of Statistics of China. "Production of refined copper in China between 2010 and 2020 (in million tons)." Chart. October 9, 2021. Statista. Accessed January 28, 2023. https://www.statista.com/statistics/279224/production-of-refined-copper-in-china/
National Bureau of Statistics of China. (2021). Production of refined copper in China between 2010 and 2020 (in million tons). Statista. Statista Inc.. Accessed: January 28, 2023. https://www.statista.com/statistics/279224/production-of-refined-copper-in-china/
National Bureau of Statistics of China. "Production of Refined Copper in China between 2010 and 2020 (in Million Tons)." Statista, Statista Inc., 9 Oct 2021, https://www.statista.com/statistics/279224/production-of-refined-copper-in-china/
National Bureau of Statistics of China, Production of refined copper in China between 2010 and 2020 (in million tons) Statista, https://www.statista.com/statistics/279224/production-of-refined-copper-in-china/ (last visited January 28, 2023)
Production of refined copper in China between 2010 and 2020 (in million tons) [Graph], National Bureau of Statistics of China, October 9, 2021. [Online]. Available: https://www.statista.com/statistics/279224/production-of-refined-copper-in-china/