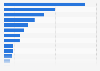
This statistic shows the number of uses of facial moisturizers / creams / lotions within 7 days in the United States from 2011 to 2020. The data has been calculated by Statista based on the U.S. Census data and Simmons National Consumer Survey (NHCS). According to this statistic, 25.54 million Americans used facial moisturizers / creams / lotions 14 or more times in 2020.
U.S. population: Number of uses of facial moisturizers / creams / lotions within 7 days from 2011 to 2020
Basic Account
Get to know the platform
You only have access to basic statistics.
This statistic is not included in your account.
Starter Account
The ideal entry-level account for individual users
- Instant access to 1m statistics
- Download in XLS, PDF & PNG format
- Detailed references
$59 USD $39 USD / Month *
in the first 12 months
Professional Account
Full access
Corporate solution including all features.
* Prices do not include sales tax.
Statistics on Anti-aging market
Cosmetics and skin care
5
- Premium Statistic Value of the global anti-aging market 2021-2027
- Premium Statistic U.S. skin care sales 2021, by segment
- Premium Statistic Sales of the leading cosmetic companies worldwide 2020
- Premium Statistic Leading cosmetics and beauty companies worldwide based on market capitalization 2022
- Basic Statistic Total revenue of biopharma companies in dermatology worldwide 2020
Cosmetics - consumer behavior
4
- Premium Statistic Usage frequency of facial moisturizer / cream / lotion used in the U.S. 2011-2020
- Premium Statistic Reasons for using facial cleansing products in the U.S. 2011-2020
- Premium Statistic Forms of moisturizer / cream / lotion used in the U.S. 2011-2020
- Basic Statistic Top influencers of U.S. consumer skin care purchases 2021
Medical treatments
4
Medical treatments - consumer attitude
4
- Basic Statistic Reasons of U.S. consumer use of cosmetic procedures 2021
- Basic Statistic Top influencers of U.S. consumer use of cosmetic procedures 2021
- Basic Statistic U.S. patient satisfaction: nonsurgical cosmetic procedures 2022
- Premium Statistic U.S. patient satisfaction: surgical cosmetic procedures 2022
Further related statistics
19
- Usage of moisturizers / creams / lotions in the U.S. 2011-2024
- Usage frequency of body moisturizer / cream / lotion in the U.S. 2011-2020
- Global skin care market value growth by type 2016-2021
- Sunscreen and suntan stock volume in Japan 2012-2021
- Sunscreen and suntan sales value in Japan 2012-2021
- Beauty essence sales volume in Japan 2012-2021
- Face washes sales volume in Japan 2012-2021
- Market share of men's skincare value sales in the UK 2013, by product type
- Beauty essence stock volume in Japan 2012-2021
- Massage and cold creams sales volume in Japan 2012-2021
- Beauty essence sales value in Japan 2012-2021
- Face washes sales value in Japan 2012-2021
- Market share of women's skincare value sales in the UK 2013, by product type
- Body care habits of French people 2018
- Men's skin care sales volume in Japan 2012-2021
- InBody's sales revenue distribution 2018, by region
- Facial masks, peeling, serum and treatment usage reasons in the UK 2017, by age
- Indonesia: skin care market average revenue per capita 2017-2025
- Export value of halal processed food to UAE South Korea 2014-2019
Further Content: You might find this interesting as well
Statistics
- Usage of moisturizers / creams / lotions in the U.S. 2011-2024
- Usage frequency of body moisturizer / cream / lotion in the U.S. 2011-2020
- Global skin care market value growth by type 2016-2021
- Sunscreen and suntan stock volume in Japan 2012-2021
- Sunscreen and suntan sales value in Japan 2012-2021
- Beauty essence sales volume in Japan 2012-2021
- Face washes sales volume in Japan 2012-2021
- Market share of men's skincare value sales in the UK 2013, by product type
- Beauty essence stock volume in Japan 2012-2021
- Massage and cold creams sales volume in Japan 2012-2021
- Beauty essence sales value in Japan 2012-2021
- Face washes sales value in Japan 2012-2021
- Market share of women's skincare value sales in the UK 2013, by product type
- Body care habits of French people 2018
- Men's skin care sales volume in Japan 2012-2021
- InBody's sales revenue distribution 2018, by region
- Facial masks, peeling, serum and treatment usage reasons in the UK 2017, by age
- Indonesia: skin care market average revenue per capita 2017-2025
- Export value of halal processed food to UAE South Korea 2014-2019
Statista. (November 1, 2020). U.S. population: Number of uses of facial moisturizers / creams / lotions within 7 days from 2011 to 2020 [Graph]. In Statista. Retrieved January 29, 2023, from https://www.statista.com/statistics/286899/usage-frequency-of-moisturizer-cream-lotion-in-the-us-trend/
Statista. "U.S. population: Number of uses of facial moisturizers / creams / lotions within 7 days from 2011 to 2020." Chart. November 1, 2020. Statista. Accessed January 29, 2023. https://www.statista.com/statistics/286899/usage-frequency-of-moisturizer-cream-lotion-in-the-us-trend/
Statista. (2020). U.S. population: Number of uses of facial moisturizers / creams / lotions within 7 days from 2011 to 2020. Statista. Statista Inc.. Accessed: January 29, 2023. https://www.statista.com/statistics/286899/usage-frequency-of-moisturizer-cream-lotion-in-the-us-trend/
Statista. "U.S. Population: Number of Uses of Facial Moisturizers / Creams / Lotions within 7 Days from 2011 to 2020." Statista, Statista Inc., 1 Nov 2020, https://www.statista.com/statistics/286899/usage-frequency-of-moisturizer-cream-lotion-in-the-us-trend/
Statista, U.S. population: Number of uses of facial moisturizers / creams / lotions within 7 days from 2011 to 2020 Statista, https://www.statista.com/statistics/286899/usage-frequency-of-moisturizer-cream-lotion-in-the-us-trend/ (last visited January 29, 2023)
U.S. population: Number of uses of facial moisturizers / creams / lotions within 7 days from 2011 to 2020 [Graph], Statista, November 1, 2020. [Online]. Available: https://www.statista.com/statistics/286899/usage-frequency-of-moisturizer-cream-lotion-in-the-us-trend/