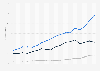
This statistic displays annual revenue figures of sporting goods stores in the United States from 2009 to 2014. In 2009 the revenue of sporting goods stores in the U.S. ranged at around 38 billion U.S. dollars.
Revenue of sporting goods stores (NAICS 45111) in the United States from 2009 to 2014 (in billion U.S. dollars)
Basic Account
Get to know the platform
You only have access to basic statistics.
This statistic is not included in your account.
Starter Account
The ideal entry-level account for individual users
- Instant access to 1m statistics
- Download in XLS, PDF & PNG format
- Detailed references
$199 USD / Month *
Professional Account
Full access
Business Solutions including all features.
* Prices do not include sales tax.
Other statistics that may interest you Statistics on
About the industry
10
- Basic Statistic Footwear and leather goods: Retail sales value trend in Great Britain 2011-2022
- Premium Statistic Sales growth of Marks & Spencer worldwide 2012-2023
- Premium Statistic Largest specialist apparel retail chains in Canada by number of outlets 2023
- Premium Statistic Revenue of Lao Feng Xiang China 2012-2022
- Premium Statistic Revenue of Lao Feng Xiang China 2021, by product
- Basic Statistic TJX Companies: number of stores worldwide 2013 - 2022
- Basic Statistic TJX Companies: number of stores worldwide 2020 to 2023, by brand
- Basic Statistic TJX Companies: global revenue share 2022, by region
- Basic Statistic TJX Companies: revenue share worldwide 2022, by product category
- Premium Statistic Number of Genesco retail stores worldwide from 2009 to 2023
About the region
9
- Premium Statistic Revenue of beauty, cosmetics & fragrance stores in the U.S., 2008-2013
- Basic Statistic Ross Stores: revenue in the United States 2014-2022
- Basic Statistic Sporting goods, hobby, book, and music per capita spending U.S. 2000-2022
- Premium Statistic Stores of the leading sports & leisure retailers in the United States in 2022
- Basic Statistic Leading sports & leisure retailers' sales growth in the United States in 2022
- Premium Statistic Revenue of nursery & garden stores in the U.S. 2015/2016
- Premium Statistic Revenue of lawn & outdoor equipment stores in the U.S., 2009-2014
- Premium Statistic Revenue of fish & seafood markets in the U.S., 2009-2014
- Premium Statistic People who shopped at Safeway in the U.S. in 2023, by age
Selected statistics
7
- Basic Statistic Number of Nike stores globally 2009-2023
- Basic Statistic John Lewis Partnership: number of employees in the United Kingdom (UK) 2009-2023
- Basic Statistic John Lewis sales revenue in the United Kingdom (UK) 2009-2023
- Basic Statistic The adidas Group's global net sales from 2002 to 2023, by product category
- Basic Statistic The adidas Group's EBITDA worldwide 2000-2023
- Premium Statistic John Lewis online sales growth in the United Kingdom (UK) 2011-2018
- Premium Statistic John Lewis online sales in the United Kingdom (UK) 2011-2016
Other regions
10
- Premium Statistic Retail sales revenue of S Group in the Baltics and Russia 2012-2022
- Premium Statistic Revenue of the Baltika Group worldwide 2013-2022
- Basic Statistic Alimentation Couche-Tard's road transportation fuel volume growth in 2021, by market
- Premium Statistic Rental and leasing of recreational and sports goods revenue in Malta 2010-2022
- Premium Statistic Rental and leasing of recreational and sports goods revenue in Austria 2010-2022
- Premium Statistic Forecast: revenue recreational & sports goods rent and lease Lithuania 2008-2020
- Basic Statistic Forecast: revenue recreational & sports goods rent and lease Germany 2009-2020
- Premium Statistic S Group's revenue 2012-2022
- Premium Statistic Leading European apparel and accessories retailers 2021, based on global sales
- Premium Statistic Revenue of Sun Hung Kai Properties 2009-2023
Related statistics
10
- Premium Statistic Revenue of ready-mix concrete manufacturing in the U.S., 2009-2021
- Premium Statistic Revenue of dairy wholesaling in the U.S., 2008-2020
- Premium Statistic Revenue of oil drilling & gas extraction in the U.S., 2009-2014
- Premium Statistic Revenue of civic, social & youth organizations in the U.S., 2009-2014
- Premium Statistic Revenue of laundromats in the U.S., 2009-2014
- Premium Statistic Revenue of for-profit universities in the U.S., 2009-2014
- Premium Statistic Revenue of electric power transmission in the U.S., 2009-2014
- Premium Statistic Revenue of mineral & phosphate mining in the U.S., 2009-2014
- Premium Statistic Revenue of loan brokers in the U.S., 2009-2014
- Premium Statistic Revenue of real estate asset management & consulting in the U.S., 2009-2014
Further related statistics
10
- John Lewis: number of stores in the United Kingdom (UK) 2009-2023
- Number of Waitrose stores in the United Kingdom (UK) 2009-2023
- Ping An Insurance's annual revenue 2012-2022
- Net revenue from investment banking at Goldman Sachs 2009-2023
- Net revenue from investing and lending at Goldman Sachs 2009-2021
- Number of retail stores of the adidas Group worldwide 2016 to 2020, by brand
- Profit margin of supermarket and hypermarket companies in China 2011-2012, by origin
- Retailers' main challenges in store in the United Kingdom (UK)
- Under Armour's operating income worldwide 2008-2023
- Waitrose sales revenue in the United Kingdom (UK) 2009-2023
Further Content: You might find this interesting as well
Statistics
- John Lewis: number of stores in the United Kingdom (UK) 2009-2023
- Number of Waitrose stores in the United Kingdom (UK) 2009-2023
- Ping An Insurance's annual revenue 2012-2022
- Net revenue from investment banking at Goldman Sachs 2009-2023
- Net revenue from investing and lending at Goldman Sachs 2009-2021
- Number of retail stores of the adidas Group worldwide 2016 to 2020, by brand
- Profit margin of supermarket and hypermarket companies in China 2011-2012, by origin
- Retailers' main challenges in store in the United Kingdom (UK)
- Under Armour's operating income worldwide 2008-2023
- Waitrose sales revenue in the United Kingdom (UK) 2009-2023
Statista. (March 15, 2014). Revenue of sporting goods stores (NAICS 45111) in the United States from 2009 to 2014 (in billion U.S. dollars) [Graph]. In Statista. Retrieved April 20, 2024, from https://www.statista.com/statistics/293166/revenue-of-sporting-goods-stores-in-the-us/
Statista. "Revenue of sporting goods stores (NAICS 45111) in the United States from 2009 to 2014 (in billion U.S. dollars)." Chart. March 15, 2014. Statista. Accessed April 20, 2024. https://www.statista.com/statistics/293166/revenue-of-sporting-goods-stores-in-the-us/
Statista. (2014). Revenue of sporting goods stores (NAICS 45111) in the United States from 2009 to 2014 (in billion U.S. dollars). Statista. Statista Inc.. Accessed: April 20, 2024. https://www.statista.com/statistics/293166/revenue-of-sporting-goods-stores-in-the-us/
Statista. "Revenue of Sporting Goods Stores (Naics 45111) in The United States from 2009 to 2014 (in Billion U.S. Dollars)." Statista, Statista Inc., 15 Mar 2014, https://www.statista.com/statistics/293166/revenue-of-sporting-goods-stores-in-the-us/
Statista, Revenue of sporting goods stores (NAICS 45111) in the United States from 2009 to 2014 (in billion U.S. dollars) Statista, https://www.statista.com/statistics/293166/revenue-of-sporting-goods-stores-in-the-us/ (last visited April 20, 2024)
Revenue of sporting goods stores (NAICS 45111) in the United States from 2009 to 2014 (in billion U.S. dollars) [Graph], Statista, March 15, 2014. [Online]. Available: https://www.statista.com/statistics/293166/revenue-of-sporting-goods-stores-in-the-us/