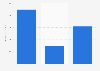
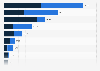
Number of star-rated hotel rooms in China 2016, by origin
The statistic depicts the number of star hotel rooms in China as of 2016, by origin of funding. That year, the room stock of star hotels originating from Hong Kong, Macao or Taiwan encompassed 49,868 rooms.