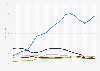
This graph shows the vehicle population in China from 2002 to 2012. In 2006, around 37 million autos were in operation in China.
Number of cars in operation in China from 2002 to 2012 (in millions)
Basic Account
Get to know the platform
You only have access to basic statistics.
This statistic is not included in your account.
Starter Account
The ideal entry-level account for individual users
- Instant access to 1m statistics
- Download in XLS, PDF & PNG format
- Detailed references
$189 USD $149 USD / Month *
in the first 12 months
Professional Account
Full access
Business Solutions including all features.
* Prices do not include sales tax.
Other statistics that may interest you Statistics on
About the industry
10
- Premium Statistic New vehicle sales and registrations of all types: Germany 2005-2021
- Premium Statistic Latin America: passenger car sales by selected countries 2022
- Premium Statistic Value of exported and imported vehicles in Germany 2012-2022
- Basic Statistic Interannual variation on motor vehicle sales in Latin America 2021-2022, by country
- Premium Statistic Spain: motor vehicle imports by origin 2021-2022
- Premium Statistic Change in PEV registrations worldwide by market 2022
- Premium Statistic Spain: employment in the manufacturing of motor vehicles and trailers 2008-2022
- Premium Statistic U.S. consumer satisfaction: Ford 2006-2022
- Premium Statistic Total sales of domestic vehicles South Korea 2012-2022
- Premium Statistic Total exports of vehicles from South Korea 2011-2022
About the region
10
- Premium Statistic Monthly automobile sales in China 2021-2022
- Premium Statistic Automobile production in China by month 2021-2022
- Premium Statistic Dongfeng Motor: auto sales 2021, by model
- Premium Statistic Car sales in China 2010-2021
- Premium Statistic Annual change of vehicle sales in China 2010-2021
- Premium Statistic Number of luxury cars in premium segment sold in China 2011-2018
- Basic Statistic Sales revenue of the leading car dealers in China 2009
- Basic Statistic Market share of car dealers in China 2009
- Premium Statistic Market share of leading Chinese car manufacturers 2011
- Premium Statistic Number of luxury passenger vehicles sold in China 2015 by brand
Selected statistics
3
Other regions
10
- Premium Statistic First registrations of trucks in Finland 2010-2022
- Premium Statistic Number of buses on the road in Belgium 2006-2019
- Premium Statistic Leading bus brands by market share in Chile 2021
- Premium Statistic Best car manufacturers based on in-car technology in Great Britain (UK) 2018
- Premium Statistic Truck market share Malaysia 2017, by brand production volume
- Premium Statistic Latin America: best selling car brands 2018
- Premium Statistic Full-time employees of Ejner Hessel A/S 2014-2019
- Premium Statistic Fatalities in road traffic accidents in Spain in 2020, by type of user
- Premium Statistic Electric vehicle market share - selected markets H1 2021
- Premium Statistic Automotive exports from Argentina by destination country 2020
Related statistics
10
- Premium Statistic Argentina: Renault Argentina S.A. car production 2010-2018
- Premium Statistic Argentina: Toyota Argentina S.A. car production 2010-2018
- Premium Statistic Argentina: Volkswagen Argentina S.A. car production 2010-2018
- Premium Statistic Argentina: General Motors car production 2010-2018
- Premium Statistic Argentina: Ford Argentina S.C.A. car production 2010-2018
- Premium Statistic Production capacity of foreign carmakers in joint ventures in China 2013
- Premium Statistic Number of ultra-luxury passenger vehicles sold in China 2015 by brand
- Premium Statistic Growth rate of luxury passenger vehicle sales in China 2015
- Premium Statistic Car sales in China 2011, by category
- Premium Statistic Sales of light vehicles in China in 2010, by brand
Further Content: You might find this interesting as well
Statistics
CAAM, & National Bureau of Statistics of China, & Social Sciences Academic Press (China). (July 15, 2013). Number of cars in operation in China from 2002 to 2012 (in millions) [Graph]. In Statista. Retrieved September 29, 2023, from https://www.statista.com/statistics/305751/china-number-of-car-population/
CAAM, und National Bureau of Statistics of China, und Social Sciences Academic Press (China). "Number of cars in operation in China from 2002 to 2012 (in millions)." Chart. July 15, 2013. Statista. Accessed September 29, 2023. https://www.statista.com/statistics/305751/china-number-of-car-population/
CAAM, National Bureau of Statistics of China, Social Sciences Academic Press (China). (2013). Number of cars in operation in China from 2002 to 2012 (in millions). Statista. Statista Inc.. Accessed: September 29, 2023. https://www.statista.com/statistics/305751/china-number-of-car-population/
CAAM, and National Bureau of Statistics of China, and Social Sciences Academic Press (China). "Number of Cars in Operation in China from 2002 to 2012 (in Millions)." Statista, Statista Inc., 15 Jul 2013, https://www.statista.com/statistics/305751/china-number-of-car-population/
CAAM & National Bureau of Statistics of China & Social Sciences Academic Press (China), Number of cars in operation in China from 2002 to 2012 (in millions) Statista, https://www.statista.com/statistics/305751/china-number-of-car-population/ (last visited September 29, 2023)
Number of cars in operation in China from 2002 to 2012 (in millions) [Graph], CAAM, & National Bureau of Statistics of China, & Social Sciences Academic Press (China), July 15, 2013. [Online]. Available: https://www.statista.com/statistics/305751/china-number-of-car-population/