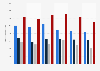
This statistic shows the retail sales volume of cat treats and mixers in the United Kingdom (UK) in 2012, with a forecast to 2017. In 2012, approximately 968.5 tonnes of cat treats and mixers were sold in the UK. Over the forecast period, sales volumes are expected to increase.
Retail sales volume of cat treats and mixers in the United Kingdom (UK) from 2012 to 2017 (in tonnes)
Basic Account
Get to know the platform
You only have access to basic statistics.
This statistic is not included in your account.
Starter Account
The ideal entry-level account for individual users
- Instant access to 1m statistics
- Download in XLS, PDF & PNG format
- Detailed references
$149 USD / Month *
Professional Account
Full access
Business Solutions including all features.
* Prices do not include sales tax.
Other statistics that may interest you Statistics on
About the industry
10
- Premium Statistic Dry cat food sales volume in the United Kingdom (UK) 2007-2018
- Premium Statistic Unit sales of private label dry pet food in the U.S. by pet type 2018
- Premium Statistic Average price of private label dry pet food in the U.S. by pet type 2018
- Premium Statistic Dollar sales of private label dry pet food in the U.S. by pet type 2018
- Premium Statistic Dollar sales share of private label dry pet food in the U.S. by pet type 2018
- Premium Statistic Sales growth of leading cat treat brands on Amazon in the United States 2020
- Basic Statistic Most common types of treats given to pet cats by owners in the UK 2019
- Premium Statistic Pet food export volume from South Korea 2010-2022
- Premium Statistic Pet food import volume South Korea 2012-2022
- Premium Statistic Pet food export value South Korea 2010-2022
About the region
10
- Premium Statistic Volume of ice cream in the UK 2018-2028
- Premium Statistic Leading soft drink brands in the United Kingdom 2018, by grocery sales value
- Premium Statistic Soft drinks sales value in grocery multiples in the United Kingdom (UK) 2018, by type
- Premium Statistic Soft drinks: convenience sales volume change United Kingdom 2018, by sub-category
- Premium Statistic Soft drink brands with greatest grocery sales value growth in the United Kingdom 2018
- Basic Statistic Retail trade volume growth monthly in the United Kingdom (UK) 2016-2018
- Premium Statistic Leading soft drink brands in the United Kingdom 2014, by grocery market share
- Premium Statistic Leading soft drink distributors in the United Kingdom 2014 by grocery sales volume
- Premium Statistic Leading soft drink distributors in the United Kingdom 2014, by market value share
- Premium Statistic Leading soft drink distributors in the United Kingdom 2014, by grocery volume share
Other regions
9
- Basic Statistic Turnover volume index of shops selling DIY articles in the Netherlands 2008-2022
- Basic Statistic Revenue index for retail trade of food, beverages and tobacco in Finland 2011-2021
- Basic Statistic Estimated U.S. electronics and appliance stores per capita sales 2000-2021
- Premium Statistic Leading 'Complete Dry Cat Food (Ms For F)' brands in FR 2022, by number of users
- Premium Statistic Non-specialized stores: retail sales volume trend in Sweden 2008-2018
- Basic Statistic Retail trade volume growth monthly in the European Union (EU) 2016-2018
- Premium Statistic Sweet biscuits sales volume share in Italy 2009-2018
- Premium Statistic Clothing retail sales volume annual index in Great Britain 2011-2022
- Premium Statistic Retail trade sales growth in Iceland 2007-2017
Related statistics
10
- Premium Statistic Food retail store sales volume trend monthly in Great Britain 2014-2021
- Basic Statistic Flowers, plants and pet food: quarterly sales volume index in Great Britain 2015-2021
- Basic Statistic Plants and pet food retail sales volume index in Great Britain 2011-2020
- Premium Statistic U.S. average price of private label pet care products by segment 2016
- Premium Statistic Forecast: Packaged fish and seafood retail sales volume in the UK 2008-2017, by type
- Basic Statistic Food, drink and tobacco sales value growth in Great Britain 2015-2022
- Basic Statistic Food retail sales volume percentage change in Great Britain 2012-2021
- Premium Statistic Cat and dog owners who buy pet treats U.S. by vet usage 2019
- Premium Statistic Cheese market: Total sales volume in Great Britain 2009-2018
- Premium Statistic Wet cat food (multi serve) sales volume in the United Kingdom (UK) 2007-2018
Further related statistics
10
- Electrical appliances retail sales volume index in Great Britain (UK) 2013-2022
- Games, toys and sports equipment: Sales volume index in Great Britain (UK) 2011-2022
- Secondhand goods: Sales volume percentage change in Great Britain (UK) 2013-2022
- Alcohol and tobacco sales volume percentage increase in Great Britain (UK) 2011-2019
- Forecast of retail sales growth in Western Europe 2008-2018
- Forecast of retail sales growth in Indonesia 2008-2018
- Footwear retail sales volume trend in Great Britain (UK) 2008-2022
- John Lewis sales revenue in the United Kingdom (UK) 2009-2023
- Waitrose sales revenue in the United Kingdom (UK) 2009-2023
- Tesco's sales worldwide 2016/2017-2022/2023, by region
Further Content: You might find this interesting as well
Statistics
- Electrical appliances retail sales volume index in Great Britain (UK) 2013-2022
- Games, toys and sports equipment: Sales volume index in Great Britain (UK) 2011-2022
- Secondhand goods: Sales volume percentage change in Great Britain (UK) 2013-2022
- Alcohol and tobacco sales volume percentage increase in Great Britain (UK) 2011-2019
- Forecast of retail sales growth in Western Europe 2008-2018
- Forecast of retail sales growth in Indonesia 2008-2018
- Footwear retail sales volume trend in Great Britain (UK) 2008-2022
- John Lewis sales revenue in the United Kingdom (UK) 2009-2023
- Waitrose sales revenue in the United Kingdom (UK) 2009-2023
- Tesco's sales worldwide 2016/2017-2022/2023, by region
Agriculture and Agri-Food Canada. (February 28, 2014). Retail sales volume of cat treats and mixers in the United Kingdom (UK) from 2012 to 2017 (in tonnes) [Graph]. In Statista. Retrieved December 06, 2023, from https://www.statista.com/statistics/310015/forecast-retail-sales-value-of-cat-treats-and-mixers-in-the-united-kingdom-uk/
Agriculture and Agri-Food Canada. "Retail sales volume of cat treats and mixers in the United Kingdom (UK) from 2012 to 2017 (in tonnes)." Chart. February 28, 2014. Statista. Accessed December 06, 2023. https://www.statista.com/statistics/310015/forecast-retail-sales-value-of-cat-treats-and-mixers-in-the-united-kingdom-uk/
Agriculture and Agri-Food Canada. (2014). Retail sales volume of cat treats and mixers in the United Kingdom (UK) from 2012 to 2017 (in tonnes). Statista. Statista Inc.. Accessed: December 06, 2023. https://www.statista.com/statistics/310015/forecast-retail-sales-value-of-cat-treats-and-mixers-in-the-united-kingdom-uk/
Agriculture and Agri-Food Canada. "Retail Sales Volume of Cat Treats and Mixers in The United Kingdom (Uk) from 2012 to 2017 (in Tonnes)." Statista, Statista Inc., 28 Feb 2014, https://www.statista.com/statistics/310015/forecast-retail-sales-value-of-cat-treats-and-mixers-in-the-united-kingdom-uk/
Agriculture and Agri-Food Canada, Retail sales volume of cat treats and mixers in the United Kingdom (UK) from 2012 to 2017 (in tonnes) Statista, https://www.statista.com/statistics/310015/forecast-retail-sales-value-of-cat-treats-and-mixers-in-the-united-kingdom-uk/ (last visited December 06, 2023)
Retail sales volume of cat treats and mixers in the United Kingdom (UK) from 2012 to 2017 (in tonnes) [Graph], Agriculture and Agri-Food Canada, February 28, 2014. [Online]. Available: https://www.statista.com/statistics/310015/forecast-retail-sales-value-of-cat-treats-and-mixers-in-the-united-kingdom-uk/