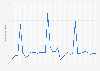
This statistic depicts key figures of the foreign-funded non-ferrous mining industry in China in 2015. In 2015, the foreign non-ferrous mining industry in China had generated a total revenue of about 10 billion yuan.
Key economic figures of the foreign-funded non-ferrous mining industry in China in 2015 (in billion yuan)
Basic Account
Get to know the platform
You only have access to basic statistics.
This statistic is not included in your account.
Starter Account
The ideal entry-level account for individual users
- Instant access to 1m statistics
- Download in XLS, PDF & PNG format
- Detailed references
$149 USD / Month *
Professional Account
Full access
Business Solutions including all features.
* Prices do not include sales tax.
Other statistics that may interest you Statistics on
About the industry
10
- Premium Statistic Revenue of Jiangxi Copper in China 2005-2022
- Basic Statistic Jiangxi Copper's net profit 2005-2022
- Premium Statistic China's nickel production volume 2010-2022
- Premium Statistic Global mine production of zinc 2005-2022
- Premium Statistic China's lead production 2010-2022
- Premium Statistic Number of non-ferrous metals production facilities in Europe 2019, by type
- Premium Statistic Number of non-ferrous metals production facilities in Europe 2019
- Basic Statistic Jiangxi Copper's number of employees in China 2015-2022
- Basic Statistic China's zinc production volume 2010-2022
- Premium Statistic Copper mine production volume in India 2011-2021
About the region
10
- Premium Statistic Key economic figures on the mining industry China 2015
- Premium Statistic Key economic figures on the chemical manufacturing industry in China 2016
- Premium Statistic Key figures of state-owned cement and concrete product manufacturing China 2015
- Premium Statistic Key economic figures on the ferrous metal smelting and pressing industry China 2015
- Premium Statistic Key economic figures on the automobile industry China 2015
- Premium Statistic Key economic figures on aerospace product and parts manufacturing industry China 2015
- Premium Statistic Key economic figures on electrical equipment manufacturing industry China 2015
- Premium Statistic Key economic figures on the waste treatment industry China 2015
- Premium Statistic Key economic figures on the food manufacturing industry China 2015
- Premium Statistic Key economic figures on the scrap metal reprocessing industry China 2015
Selected statistics
2
Other regions
10
- Basic Statistic Canada's mining and mineral processing industry trade by trade category 2005-2020
- Premium Statistic African mining exploration budget 2010-2019
- Premium Statistic Monthly prices for nickel worldwide from January 2014 to September 2023
- Premium Statistic Italy: leading countries for exports of non-ferrous metals 2016-2018, by export value
- Premium Statistic Operating revenue from mining support service activities in Saudi Arabia 2010-2017
- Premium Statistic In-use stock of aluminum and copper scrap in the European Union 2015-2020
- Premium Statistic U.S. mining exploration budget 2008-2017
- Premium Statistic Quarterly return assets investment funds in the Netherlands 2015-2023
- Premium Statistic Export value of metals and minerals Vietnam 2020, by major market
- Premium Statistic Aluminum shapes and profiles demand in Japan 2013-2022
Related statistics
10
- Premium Statistic Key figures of state-owned cement and concrete manufacturing China 2015
- Premium Statistic Production of pyrite China 1960-2015
- Premium Statistic Production of phosphate China 1960-2015
- Premium Statistic Production value of marble in Taiwan 2007-2020, by type
- Premium Statistic Tongling Nonferrous Metals Group number of employees in China 2015-2019
- Premium Statistic Tongling Nonferrous Metals Group total assets in China 2015-2019
- Premium Statistic Tongling Nonferrous Metals Group net profit in China 2016-2019
- Premium Statistic Average sales price of copper in China 2011-2021
- Premium Statistic Production volume of copper products in China 2011-2021
- Premium Statistic Sales value of marble in Taiwan 2007-2020 by type
Further related statistics
10
- Rio Tinto's net income 2001-2022
- Operating income of the Industrial and Commercial Bank of China 2012-2022
- Total assets of the Industrial and Commercial Bank of China 2012-2022
- Total assets of the Bank of Communications 2012-2022
- Total assets of the China Construction Bank 2012-2022
- Agnico-Eagle Mines' gold reserves 2000-2022
- Agnico-Eagle Mines' average gold price realized 2010-2022
- China Mobile's EBITDA 2012-2022
- Total assets of China Pacific Insurance 2012-2022
- Number of Rio Tinto's employees 2010-2022
Further Content: You might find this interesting as well
Statistics
- Rio Tinto's net income 2001-2022
- Operating income of the Industrial and Commercial Bank of China 2012-2022
- Total assets of the Industrial and Commercial Bank of China 2012-2022
- Total assets of the Bank of Communications 2012-2022
- Total assets of the China Construction Bank 2012-2022
- Agnico-Eagle Mines' gold reserves 2000-2022
- Agnico-Eagle Mines' average gold price realized 2010-2022
- China Mobile's EBITDA 2012-2022
- Total assets of China Pacific Insurance 2012-2022
- Number of Rio Tinto's employees 2010-2022
National Bureau of Statistics of China. (November 1, 2016). Key economic figures of the foreign-funded non-ferrous mining industry in China in 2015 (in billion yuan) [Graph]. In Statista. Retrieved December 04, 2023, from https://www.statista.com/statistics/312855/china-foreign-non-ferrous-mining-industry-key-figures/
National Bureau of Statistics of China. "Key economic figures of the foreign-funded non-ferrous mining industry in China in 2015 (in billion yuan)." Chart. November 1, 2016. Statista. Accessed December 04, 2023. https://www.statista.com/statistics/312855/china-foreign-non-ferrous-mining-industry-key-figures/
National Bureau of Statistics of China. (2016). Key economic figures of the foreign-funded non-ferrous mining industry in China in 2015 (in billion yuan). Statista. Statista Inc.. Accessed: December 04, 2023. https://www.statista.com/statistics/312855/china-foreign-non-ferrous-mining-industry-key-figures/
National Bureau of Statistics of China. "Key Economic Figures of The Foreign-funded Non-ferrous Mining Industry in China in 2015 (in Billion Yuan)." Statista, Statista Inc., 1 Nov 2016, https://www.statista.com/statistics/312855/china-foreign-non-ferrous-mining-industry-key-figures/
National Bureau of Statistics of China, Key economic figures of the foreign-funded non-ferrous mining industry in China in 2015 (in billion yuan) Statista, https://www.statista.com/statistics/312855/china-foreign-non-ferrous-mining-industry-key-figures/ (last visited December 04, 2023)
Key economic figures of the foreign-funded non-ferrous mining industry in China in 2015 (in billion yuan) [Graph], National Bureau of Statistics of China, November 1, 2016. [Online]. Available: https://www.statista.com/statistics/312855/china-foreign-non-ferrous-mining-industry-key-figures/