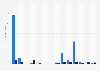
This statistic displays the total coffee consumption in Taiwan between 1990 and 2012. In 2006, approximately 290,000 60kg bags of coffee had been consumed in Taiwan.
Total coffee consumption in Taiwan from 1990 to 2012 (in 1,000 bags*)
Basic Account
Get to know the platform
You only have access to basic statistics.
This statistic is not included in your account.
Starter Account
The ideal entry-level account for individual users
- Instant access to 1m statistics
- Download in XLS, PDF & PNG format
- Detailed references
$199 USD / Month *
Professional Account
Full access
Business Solutions including all features.
* Prices do not include sales tax.
Other statistics that may interest you Statistics on
About the industry
10
- Premium Statistic Total coffee consumption in South Korea 2019-2022/23
- Premium Statistic Total coffee production in China 1994-2014
- Premium Statistic Per capita coffee consumption in Vietnam 1990-2012
- Premium Statistic Per capita coffee consumption in Taiwan 1990-2012
- Premium Statistic Per capita coffee consumption in South Korea 1990-2012
- Premium Statistic Per capita coffee consumption on the Philippines 1990-2012
- Premium Statistic Per capita coffee consumption in Indonesia 1990-2012
- Premium Statistic Per capita coffee consumption in China 1998-2012
- Premium Statistic Total coffee consumption in China 1994-2014
- Premium Statistic Consumption volume of green coffee in Ecuador 2010/11-2023/24
About the region
10
- Premium Statistic Green coffee bean imports in Taiwan 2017-2023
- Premium Statistic Coffee consumption in Taiwan 2018-2024
- Premium Statistic Coffee imports in Taiwan 2017-2023
- Premium Statistic Number of visitor arrivals in Hong Kong from Taiwan 2013-2023
- Premium Statistic Coffee consumption per capita in Greater China 2018, by region
- Premium Statistic Quarterly GDP growth rate in Taiwan Q4 2020-Q4 2024
- Premium Statistic GDP growth rate in Taiwan 2000-2024
- Premium Statistic Value of animal and vegetable oils and fat exports from Taiwan 2012-2022
- Premium Statistic Gross domestic product (GDP) at current prices in Taiwan 2013-2024
- Premium Statistic Total number of households in Taiwan 2013-2023
Other regions
10
- Premium Statistic Import value of coffee, tea and spices in Poland 2008-2022
- Premium Statistic Survey on drinking selected types of coffee in Norway 2000-2017
- Premium Statistic Instant coffee imports in China 2018-2023
- Basic Statistic Quantity of tea, coffee and water consumed in the United Kingdom 2008-2012, by age
- Premium Statistic Coffee chain market share in the Nordic countries 2015
- Premium Statistic Number of branded coffee outlets in the Nordic countries 2015
- Premium Statistic Market share of selected filter coffee brands in Sweden 2017
- Premium Statistic U.S. coffee consumption: caffeine amount in coffee by brand 2013
- Premium Statistic Consumption of instant coffee in Germany 2005-2017*
- Premium Statistic Coffee consumption Thailand 1990-2019
Related statistics
10
- Premium Statistic Green coffee bean exports from China 2018-2024
- Premium Statistic Green coffee bean imports in China 2018-2024
- Premium Statistic Instant coffee exports from China 2018-2023
- Premium Statistic Coffee exports from China 2018-2024
- Premium Statistic Coffee consumption in China 2018-2024
- Premium Statistic Import volume of coffee China 2009-2019
- Premium Statistic Retail sales value of cosmetics in China 2014-2023
- Premium Statistic Annual growth of cosmetics retail sales value China 2013-2023
- Premium Statistic Fresh coffee market share by brand in China 2020
- Premium Statistic Coffee consumption distribution China 2017-2020, by type
Further related statistics
10
- Primary energy consumption in China 2012-2022
- Store number growth of the leading 100 retailers in China 2010-2012, by city tier
- Profit margin of supermarket and hypermarket companies in China 2011-2012, by origin
- Percentage of U.S. population groups with a bachelor's degree, by ethnicity 2010
- Change in U.S. Chinese population from 1980 to 2010
- Change in foreign-born Chinese-American population from 1980 to 2010
- Number of Starbucks stores in the UK from 2005 to 2023
- Company-operated Starbucks stores retail sales distribution worldwide 2005-2023
- Operating income of Starbucks 2007-2023
- Total assets of Starbucks 2007-2023
Further Content: You might find this interesting as well
Statistics
- Primary energy consumption in China 2012-2022
- Store number growth of the leading 100 retailers in China 2010-2012, by city tier
- Profit margin of supermarket and hypermarket companies in China 2011-2012, by origin
- Percentage of U.S. population groups with a bachelor's degree, by ethnicity 2010
- Change in U.S. Chinese population from 1980 to 2010
- Change in foreign-born Chinese-American population from 1980 to 2010
- Number of Starbucks stores in the UK from 2005 to 2023
- Company-operated Starbucks stores retail sales distribution worldwide 2005-2023
- Operating income of Starbucks 2007-2023
- Total assets of Starbucks 2007-2023
ICO. (February 27, 2014). Total coffee consumption in Taiwan from 1990 to 2012 (in 1,000 bags*) [Graph]. In Statista. Retrieved April 19, 2024, from https://www.statista.com/statistics/314994/taiwan-total-coffee-consumption/
ICO. "Total coffee consumption in Taiwan from 1990 to 2012 (in 1,000 bags*)." Chart. February 27, 2014. Statista. Accessed April 19, 2024. https://www.statista.com/statistics/314994/taiwan-total-coffee-consumption/
ICO. (2014). Total coffee consumption in Taiwan from 1990 to 2012 (in 1,000 bags*). Statista. Statista Inc.. Accessed: April 19, 2024. https://www.statista.com/statistics/314994/taiwan-total-coffee-consumption/
ICO. "Total Coffee Consumption in Taiwan from 1990 to 2012 (in 1,000 Bags*)." Statista, Statista Inc., 27 Feb 2014, https://www.statista.com/statistics/314994/taiwan-total-coffee-consumption/
ICO, Total coffee consumption in Taiwan from 1990 to 2012 (in 1,000 bags*) Statista, https://www.statista.com/statistics/314994/taiwan-total-coffee-consumption/ (last visited April 19, 2024)
Total coffee consumption in Taiwan from 1990 to 2012 (in 1,000 bags*) [Graph], ICO, February 27, 2014. [Online]. Available: https://www.statista.com/statistics/314994/taiwan-total-coffee-consumption/