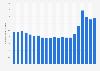
This statistic shows the net balance of UK consumers spending more on going out (e.g. cinema, theatre, concerts etc.) in the United Kingdom annually from 1st quarter 2012 to 1st quarter 2016. According to Deloitte's consumer tracker, consumers spent less on going out over the past three months of each quarter. In quarter 1 of 2015, spending on going out was measured at a net balance of minus 15 percent.
Net percentage of consumers spending more on going out in the United Kingdom (UK) from 1st quarter 2012 to 1st quarter 2016*
Basic Account
Get to know the platform
You only have access to basic statistics.
This statistic is not included in your account.
Starter Account
The ideal entry-level account for individual users
- Instant access to 1m statistics
- Download in XLS, PDF & PNG format
- Detailed references
$199 USD / Month *
Professional Account
Full access
Business Solutions including all features.
* Prices do not include sales tax.
Other statistics that may interest you Statistics on
About the industry
10
- Premium Statistic International travel expenditure in Hungary 2012-2023
- Premium Statistic Value added of tourism in Norway 2020, by industry
- Premium Statistic Year on year change in spend during visits from Canada to the UK 2004-2019
- Premium Statistic Year on year change in spend during visits from Russia to the UK 2004-2019
- Basic Statistic Spending on visits from Sweden in the UK 2004-2019
- Basic Statistic Spending on visits from Switzerland in the UK 2004-2019
- Basic Statistic Spending on visits from Denmark to the UK 2004-2019
- Premium Statistic International travel spending in Italy 2010-2018
- Premium Statistic Tourist spending in France 2018, by expenditure item
- Premium Statistic Projected spending among affluent Millennials in Vietnam 2019, by category
About the region
10
- Basic Statistic UK development of consumers spending on furniture and homeware 2011-2015
- Premium Statistic UK consumers spending more on restaurants and hotels 2012-2016
- Premium Statistic UK consumers expecting to spend more on restaurants and hotels 2012-2016
- Basic Statistic UK consumers spending more on phone, internet and cable subscriptions 2011-2015
- Premium Statistic Cinema, theatre and museums: Weekly UK household expenditure 2022, by gross income
- Premium Statistic Sports leisure: Weekly household expenditure in the United Kingdom (UK) 2020, by age
- Premium Statistic Entertainment and leisure: Where consumers access n the United Kingdom (UK) 2013
- Premium Statistic Cinema, theater and museums: weekly UK household expenditure 2020-2022, by age
- Premium Statistic Share of UK household spend on cinema, theater, and museums 2020-2022, by income
- Premium Statistic Share of UK household spend going on gambling, by disposable income group 2020
Other regions
10
- Premium Statistic Spending on actual rentals for housing in Poland 2010-2022
- Basic Statistic Average shopping spend in Great Britain 2012-2013, by location
- Premium Statistic Importance of purchasing local products among consumers in Ireland 2017, by age
- Premium Statistic Share of consumer spending on transport in ASEAN 2015, by country
- Premium Statistic Intentions of celebrating Friend's Day Argentina 2017
- Premium Statistic Going to theatre or music concerts in England 2016, by age
- Basic Statistic Leisure activities penetration in France 2015, by gender
- Premium Statistic Year-over-year change in monthly consumer spending in Canada 2014-2019
- Basic Statistic Russians online spending plans during COVID-19 in April 2020, by channel
- Premium Statistic Discretionary expense among customers India 2020, by product category
Related statistics
10
- Basic Statistic Alternatives to visiting pubs & restaurants during COVID-19 lockdown in the UK 2020
- Basic Statistic Number of visitors to Yosemite National Park in the U.S. 2008-2023
- Basic Statistic Number of visitors to Independence National Historical Park in the U.S. 2008-2023
- Basic Statistic Hours per day spent on socializing and communicating by the U.S. population 2009-2022
- Premium Statistic Share of U.S. population engaged in socializing and communication per day 2009-2022
- Basic Statistic Cities with the highest spending per capita on parks and recreation in the U.S. 2022
- Premium Statistic Most visited amusement parks in the Netherlands 2022
- Premium Statistic Visitor numbers to theme park Slagharen in the Netherlands 2011-2022
- Premium Statistic Visitor numbers to theme park Duinrell in the Netherlands 2011-2022
- Premium Statistic Leisure and hospitality sector revenues in the UK 2016-2021, by sector
Further related statistics
9
- Snowboarding participation in the U.S. 2010-2023
- Percentage of U.S. population engaged in sports and exercise per day 2010-2022
- Ethical personal products: spending in the United Kingdom (UK) 2011-2021
- Per capita consumer spending in India 1974-2012
- How American employees plan to spend their year-end bonus 2011
- Employee compensation and benefits at Deutsche Bank 2006-2022
- Preferred sports among Chinese millionairs 2024
- Outdoor participation in the U.S. 2021, by household income
- Retail video market: consumer spending on physical video in France 2008-2022
Further Content: You might find this interesting as well
Statistics
- Snowboarding participation in the U.S. 2010-2023
- Percentage of U.S. population engaged in sports and exercise per day 2010-2022
- Ethical personal products: spending in the United Kingdom (UK) 2011-2021
- Per capita consumer spending in India 1974-2012
- How American employees plan to spend their year-end bonus 2011
- Employee compensation and benefits at Deutsche Bank 2006-2022
- Preferred sports among Chinese millionairs 2024
- Outdoor participation in the U.S. 2021, by household income
- Retail video market: consumer spending on physical video in France 2008-2022
Deloitte. (May 20, 2016). Net percentage of consumers spending more on going out in the United Kingdom (UK) from 1st quarter 2012 to 1st quarter 2016* [Graph]. In Statista. Retrieved April 24, 2024, from https://www.statista.com/statistics/339950/change-consumer-spending-going-out-united-kingdom-uk/
Deloitte. "Net percentage of consumers spending more on going out in the United Kingdom (UK) from 1st quarter 2012 to 1st quarter 2016*." Chart. May 20, 2016. Statista. Accessed April 24, 2024. https://www.statista.com/statistics/339950/change-consumer-spending-going-out-united-kingdom-uk/
Deloitte. (2016). Net percentage of consumers spending more on going out in the United Kingdom (UK) from 1st quarter 2012 to 1st quarter 2016*. Statista. Statista Inc.. Accessed: April 24, 2024. https://www.statista.com/statistics/339950/change-consumer-spending-going-out-united-kingdom-uk/
Deloitte. "Net Percentage of Consumers Spending More on Going out in The United Kingdom (Uk) from 1st Quarter 2012 to 1st Quarter 2016*." Statista, Statista Inc., 20 May 2016, https://www.statista.com/statistics/339950/change-consumer-spending-going-out-united-kingdom-uk/
Deloitte, Net percentage of consumers spending more on going out in the United Kingdom (UK) from 1st quarter 2012 to 1st quarter 2016* Statista, https://www.statista.com/statistics/339950/change-consumer-spending-going-out-united-kingdom-uk/ (last visited April 24, 2024)
Net percentage of consumers spending more on going out in the United Kingdom (UK) from 1st quarter 2012 to 1st quarter 2016* [Graph], Deloitte, May 20, 2016. [Online]. Available: https://www.statista.com/statistics/339950/change-consumer-spending-going-out-united-kingdom-uk/