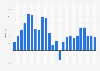
This statistic shows the approximate value of gravel and sand production in the United Kingdom (UK) from 2006 to 2014. The value of gravel and sand produced in the United Kingdom fell by over 250 million British pounds between 2006 and 2012.
Approximate value of sand and gravel produced in the United Kingdom (UK) between 2006 and 2014 (in million GBP)
Basic Account
Get to know the platform
You only have access to basic statistics.
This statistic is not included in your account.
Starter Account
The ideal entry-level account for individual users
- Instant access to 1m statistics
- Download in XLS, PDF & PNG format
- Detailed references
$199 USD / Month *
Professional Account
Full access
Business Solutions including all features.
* Prices do not include sales tax.
Other statistics that may interest you Statistics on
About the industry
10
- Premium Statistic Production of granite in Egypt 2011-2018
- Premium Statistic Production of marble blocks in Egypt 2012-2018
- Premium Statistic Limestone and dolomite production value in the United Kingdom (UK) 2006-2014
- Premium Statistic China clay production value in the United Kingdom (UK) 2006-2014
- Premium Statistic Production of limestone in Egypt 2011-2019
- Premium Statistic Metallic mineral reserves in China 2022. by type
- Basic Statistic Production value of sand and gravel in Canada 2022, by province
- Premium Statistic Production of sand and gravel in Canada by province 2022
- Premium Statistic Active mines in the U.S. by commodity 2022
- Premium Statistic Proved reserves of major mineral resources in China 2022
About the region
10
- Basic Statistic Silica sand import value United Kingdom (UK) 2009-2014
- Premium Statistic Beryllium import value in the United Kingdom (UK) 2009-2021
- Basic Statistic Gold import value in the United Kingdom (UK) by type 2010-2021
- Basic Statistic Bismuth import value in the United Kingdom (UK) 2009-2021
- Basic Statistic Gold export value in the United Kingdom (UK) 2009-2021
- Premium Statistic Marble dimension stone import volume United Kingdom (UK) 2009-2021
- Basic Statistic Mercury import value in the United Kingdom (UK) 2010-2021
- Premium Statistic Ready-mixed concrete production United Kingdom (UK) 2015-2021
- Premium Statistic Titanium dioxide pigment production United Kingdom (UK) 2009-2021
- Premium Statistic Titanium apparent consumption in the United Kingdom (UK) 2009-2021
Selected statistics
1
Other regions
10
- Basic Statistic Canada's leading minerals by production value 2015
- Premium Statistic Germany: monthly value of aluminium exports 2017
- Premium Statistic Cement consumption in the United Kingdom (UK) 2014-2021
- Basic Statistic Primary aggregate import volume by Belgium 2008-2014
- Premium Statistic Italy: quarrying extraction in Lombardy 2014, by type of mineral
- Premium Statistic Ireland: monthly value of zinc exports 2017
- Premium Statistic Turkey: monthly value of copper exports 2017-2018
- Premium Statistic Value of copper exports from Russia monthly 2021-2023
- Premium Statistic Production volume of sand and gravel Philippines 2012-2021
- Premium Statistic Forecast of rare earth oxide samarium oxide price globally 2009-2025
Related statistics
10
- Premium Statistic Refined lead production United Kingdom (UK) 2009-2021
- Premium Statistic Copper consumption United Kingdom (UK) 2009-2021
- Basic Statistic Copper export volume United Kingdom (UK) by type 2010-2021
- Basic Statistic Ferro-silicon compounds import volume United Kingdom (UK) 2009-2021
- Basic Statistic Germanium import value in the United Kingdom (UK) 2009-2021
- Premium Statistic Bauxite import volume United Kingdom (UK) 2009-2021
- Basic Statistic Silver import value in the United Kingdom (UK) 2010-2021
- Basic Statistic Germanium export value in the United Kingdom (UK) 2009-2021
- Premium Statistic Platinum group metals import value to the United Kingdom (UK) 2010-2021, by commodity
- Basic Statistic Platinum group metals export value United Kingdom (UK) 2009-2021
Further related statistics
10
- Coal consumption in South Africa 1998-2022
- Rio Tinto's net income 2005-2023
- Leading cement producing countries worldwide 2023
- Global barite mine production 2023, by country
- Crushed stone price in the U.S. 2010-2023
- Oil exports from the U.S. 1998-2022
- Primary energy consumption in Germany 1998-2022
- Global oil production share 2022, by country
- Oil exports from the Middle East 1998-2022
- Primary energy consumption in Asia Pacific 2022
Further Content: You might find this interesting as well
Statistics
- Coal consumption in South Africa 1998-2022
- Rio Tinto's net income 2005-2023
- Leading cement producing countries worldwide 2023
- Global barite mine production 2023, by country
- Crushed stone price in the U.S. 2010-2023
- Oil exports from the U.S. 1998-2022
- Primary energy consumption in Germany 1998-2022
- Global oil production share 2022, by country
- Oil exports from the Middle East 1998-2022
- Primary energy consumption in Asia Pacific 2022
British Geological Survey. (September 1, 2016). Approximate value of sand and gravel produced in the United Kingdom (UK) between 2006 and 2014 (in million GBP) [Graph]. In Statista. Retrieved April 19, 2024, from https://www.statista.com/statistics/372954/sand-and-gravel-production-value-in-the-united-kingdom-uk/
British Geological Survey. "Approximate value of sand and gravel produced in the United Kingdom (UK) between 2006 and 2014 (in million GBP)." Chart. September 1, 2016. Statista. Accessed April 19, 2024. https://www.statista.com/statistics/372954/sand-and-gravel-production-value-in-the-united-kingdom-uk/
British Geological Survey. (2016). Approximate value of sand and gravel produced in the United Kingdom (UK) between 2006 and 2014 (in million GBP). Statista. Statista Inc.. Accessed: April 19, 2024. https://www.statista.com/statistics/372954/sand-and-gravel-production-value-in-the-united-kingdom-uk/
British Geological Survey. "Approximate Value of Sand and Gravel Produced in The United Kingdom (Uk) between 2006 and 2014 (in Million Gbp)." Statista, Statista Inc., 1 Sep 2016, https://www.statista.com/statistics/372954/sand-and-gravel-production-value-in-the-united-kingdom-uk/
British Geological Survey, Approximate value of sand and gravel produced in the United Kingdom (UK) between 2006 and 2014 (in million GBP) Statista, https://www.statista.com/statistics/372954/sand-and-gravel-production-value-in-the-united-kingdom-uk/ (last visited April 19, 2024)
Approximate value of sand and gravel produced in the United Kingdom (UK) between 2006 and 2014 (in million GBP) [Graph], British Geological Survey, September 1, 2016. [Online]. Available: https://www.statista.com/statistics/372954/sand-and-gravel-production-value-in-the-united-kingdom-uk/