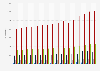
This statistic shows the gross value added (GVA) of construction in Northern Ireland from 2000 to 2017. The figures show growth to over 2.5 billion British pounds in 2017.
Gross value added (GVA) of construction in Northern Ireland from 2000 to 2017 (in million GBP)
Basic Account
Get to know the platform
You only have access to basic statistics.
This statistic is not included in your account.
Starter Account
The ideal entry-level account for individual users
- Instant access to 1m statistics
- Download in XLS, PDF & PNG format
- Detailed references
$199 USD / Month *
Professional Account
Full access
Business Solutions including all features.
* Prices do not include sales tax.
Other statistics that may interest you Statistics on
About the industry
10
- Premium Statistic GVA of accommodation and food services in Northern Ireland 2000 to 2017
- Premium Statistic GVA of electricity and gas supply in London 2000 to 2017
- Premium Statistic GVA of water supply in London (UK) 2000 to 2017
- Premium Statistic GVA of construction in London 2000 to 2017
- Premium Statistic GVA of financial and insurance activities in London (UK) 2000-2017
- Premium Statistic GVA of manufacturing in Northern Ireland 2000 to 2017
- Premium Statistic GVA of education in London (UK) 2000-2017
- Premium Statistic Real GDP growth rate Japan Q1 2017-Q4 2023
- Premium Statistic Monthly labor costs index points of China 2022-2024
- Premium Statistic U.S. real value added to GDP 1990-2022, by sector
About the region
10
- Basic Statistic GDP of Northern Ireland 1998-2021
- Premium Statistic Northern Ireland: gross value added (GVA), by industry 2017
- Basic Statistic New dwellings completed in Northern Ireland 2000-2021
- Premium Statistic Number of private sector businesses in Northern Ireland 2010-2023
- Basic Statistic Number of housing completions in Northern Ireland 2000-2022, by tenure
- Premium Statistic Biggest sectors of the construction industry in Northern Ireland 2014-2020
- Basic Statistic Employment in finance and insurance sector in Northern Ireland (UK) 2014-2019
- Basic Statistic New dwellings started in Northern Ireland 2010-2019
- Premium Statistic Share of businesses who have made Brexit plans in Ireland & Northern Ireland Q2 2019
- Premium Statistic Distribution of total weekly household incomes in Northern Ireland 2017/18
Other regions
10
- Premium Statistic London: gross value added (GVA), by industry 2017
- Premium Statistic Usual weekly hours of work for the self-employed in the UK 1995-2023, by weekly hours
- Premium Statistic Percentage of employed people that can work from home in the European Union 2002-2020
- Basic Statistic Informal sector employment in Kenya 2022, by activity
- Premium Statistic Industrial buildings in South Korea 2005-2022
- Basic Statistic Greece: number of employees in the civil engineering industry 2013-2021
- Premium Statistic Labor costs in construction industry MENA 2021, by job and country
- Basic Statistic Unemployment rate in Angola 2021, by gender
- Basic Statistic Average weekly hours worked on the main job in Finland 2011-2021
- Premium Statistic Quarterly employed labor force in Italy 2019-2020
Related statistics
10
- Premium Statistic Usual weekly hours of all employed people in London (UK) 2017/18
- Premium Statistic Economically inactive people in London (UK) in 2017/18, by gender and age
- Premium Statistic Average weekly hours of full-time work in London (UK) 2014/15 to 2017/18, by gender
- Premium Statistic Average weekly hours of part-time work in London (UK) 2012-2017, by gender
- Premium Statistic Northern England (UK) employment rates from 1998 to 2014
- Premium Statistic Youth unemployment rate in London 2001-2023
- Premium Statistic Unemployment rate in London 1992-2023
- Premium Statistic Employment rate in the United Kingdom 2000-2019, by gender
- Premium Statistic Economically inactive people in London (UK) 2012 to 2016, by gender
- Premium Statistic GDP per capita London 1998 to 2021
Further related statistics
10
- Biofuels related jobs worldwide by region 2019
- Number of employees of Vinci worldwide 1991-2023
- Number of Rio Tinto's employees 2010-2023
- Number of CBRE Group employees 2009-2022
- Main employment centers of HSBC in 2023, by number of employees
- Johnson & Johnson's number of employees 2004-2023
- Leading cement producing countries worldwide 2023
- Construction exports worldwide 2020-2021, by country
- Workforce of not-for-profit theaters in the U.S. 2009-2022
- Net fees income of Hays worldwide 2007-2023
Further Content: You might find this interesting as well
Statistics
- Biofuels related jobs worldwide by region 2019
- Number of employees of Vinci worldwide 1991-2023
- Number of Rio Tinto's employees 2010-2023
- Number of CBRE Group employees 2009-2022
- Main employment centers of HSBC in 2023, by number of employees
- Johnson & Johnson's number of employees 2004-2023
- Leading cement producing countries worldwide 2023
- Construction exports worldwide 2020-2021, by country
- Workforce of not-for-profit theaters in the U.S. 2009-2022
- Net fees income of Hays worldwide 2007-2023
GOV.UK, & Office for National Statistics (UK). (December 12, 2018). Gross value added (GVA) of construction in Northern Ireland from 2000 to 2017 (in million GBP) [Graph]. In Statista. Retrieved April 25, 2024, from https://www.statista.com/statistics/384237/gva-of-construction-in-northern-ireland-timeline-uk/
GOV.UK, und Office for National Statistics (UK). "Gross value added (GVA) of construction in Northern Ireland from 2000 to 2017 (in million GBP)." Chart. December 12, 2018. Statista. Accessed April 25, 2024. https://www.statista.com/statistics/384237/gva-of-construction-in-northern-ireland-timeline-uk/
GOV.UK, Office for National Statistics (UK). (2018). Gross value added (GVA) of construction in Northern Ireland from 2000 to 2017 (in million GBP). Statista. Statista Inc.. Accessed: April 25, 2024. https://www.statista.com/statistics/384237/gva-of-construction-in-northern-ireland-timeline-uk/
GOV.UK, and Office for National Statistics (UK). "Gross Value Added (Gva) of Construction in Northern Ireland from 2000 to 2017 (in Million Gbp)." Statista, Statista Inc., 12 Dec 2018, https://www.statista.com/statistics/384237/gva-of-construction-in-northern-ireland-timeline-uk/
GOV.UK & Office for National Statistics (UK), Gross value added (GVA) of construction in Northern Ireland from 2000 to 2017 (in million GBP) Statista, https://www.statista.com/statistics/384237/gva-of-construction-in-northern-ireland-timeline-uk/ (last visited April 25, 2024)
Gross value added (GVA) of construction in Northern Ireland from 2000 to 2017 (in million GBP) [Graph], GOV.UK, & Office for National Statistics (UK), December 12, 2018. [Online]. Available: https://www.statista.com/statistics/384237/gva-of-construction-in-northern-ireland-timeline-uk/