This statistic shows the market share of Land Rover cars sold in Europe every year between 2000 and 2019. The market share fluctuated between 0.4 and 0.65 between 2000 and 2011, but after 2012, Land Rover's share of the European market has sat between 0.9 and 1.1 percent.
Land Rover's share of the European automotive market from 2000 to 2019*
Basic Account
Get to know the platform
You only have access to basic statistics.
This statistic is not included in your account.
Starter Account
The ideal entry-level account for individual users
- Instant access to 1m statistics
- Download in XLS, PDF & PNG format
- Detailed references
$69 USD $49 USD / Month *
in the first 12 months
Professional Account
Full access
Business Solutions including all features.
* Prices do not include sales tax.
Other statistics that may interest you
Financials
4
Global sales
8
- Premium Statistic Premium vehicles - luxury car market size worldwide 2010-2022
- Premium Statistic Jaguar Land Rover: global sales volume 2011-2021
- Premium Statistic Jaguar Land Rover: global wholesales volume 2011-2021
- Premium Statistic Jaguar Land Rover: global sales, by region 2015-2019
- Premium Statistic Sales volume of Jaguar cars 2015-2021, by region
- Premium Statistic Volume of Land Rover cars sold 2015/2016-2019/2020, by region
- Premium Statistic Jaguar models: global sales, by model 2013-2019
- Premium Statistic Land Rover models: global sales, by model 2013-2019
Sales by country
8
- Premium Statistic 
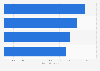
Land Rover: yearly market share in Europe 2000-2019
- Premium Statistic Land Rover: yearly car sales in Europe 2000-2019
- Premium Statistic Land Rover: monthly car sales in Europe 2014-2019
- Basic Statistic Large luxury vehicle sales by model in the United States 2020
- Basic Statistic Land Rover car sales in the United Kingdom (UK) 2019-2020
- Premium Statistic Jaguar car sales in the United Kingdom (UK) 2019-2020
- Premium Statistic Land Rover car sales in Germany 2008-2020
- Premium Statistic Jaguar car sales in Germany 2008-2020
Registration figures in the UK
7
- Basic Statistic Land Rover Range Rover cars registered in Great Britain 2000-2020
- Basic Statistic Land Rover Discovery cars registered in Great Britain 2000-2020
- Basic Statistic Land Rover Freelander cars registered in Great Britain 2000-2020
- Basic Statistic Land Rover Defender LGVs registered in Great Britain 2000-2019
- Basic Statistic Jaguar XF cars registered in Great Britain 2007-2020
- Basic Statistic Jaguar X-Type cars registered in Great Britain 2001-2020
- Basic Statistic Jaguar XE series cars registered in Great Britain 2015-2020
Brand comparison
4
- Premium Statistic Global car sales by selected luxury brands 2022
- Basic Statistic New car registrations in the United Kingdom (UK) 2020, by brand
- Premium Statistic Best-selling light commercial vehicle brands in the UK 2021
- Basic Statistic Car production in the United Kingdom (UK) 2013-2021, by brand
Further related statistics
12
- Number of Landrover ars registered in Hong Kong 2019, by year of manufacture
- Market share of the Jaguar Land Rover group in Italy 2013-2016
- Sales volume of the Jaguar Land Rover cars in Italy 2013-2016
- Land Rover car sales in Norway 2009-2017
- Land Rover: Output in Solihull, United Kingdom (UK) in 2014
- Land Rover light goods vehicles registered in Hong Kong 2019, by year of manufacture
- Ownership of Land Rover models in Great Britain 2013-2020, by number of users
- Land Rover: new light commercial vehicle registrations in the UK 2014-2016, by month
- Jaguar Land Rover: wholesale distribution 2019/2020, by region
- Jaguar Land Rover car market share in the United Kingdom (UK) 2016-2019
- Car-smartphone connection usage in Australia 2022
- China - age of owned or leased cars 2016-2018
Further Content: You might find this interesting as well
Statistics
- Number of Landrover ars registered in Hong Kong 2019, by year of manufacture
- Market share of the Jaguar Land Rover group in Italy 2013-2016
- Sales volume of the Jaguar Land Rover cars in Italy 2013-2016
- Land Rover car sales in Norway 2009-2017
- Land Rover: Output in Solihull, United Kingdom (UK) in 2014
- Land Rover light goods vehicles registered in Hong Kong 2019, by year of manufacture
- Ownership of Land Rover models in Great Britain 2013-2020, by number of users
- Land Rover: new light commercial vehicle registrations in the UK 2014-2016, by month
- Jaguar Land Rover: wholesale distribution 2019/2020, by region
- Jaguar Land Rover car market share in the United Kingdom (UK) 2016-2019
- Car-smartphone connection usage in Australia 2022
- China - age of owned or leased cars 2016-2018
CarSalesBase. (January 30, 2020). Land Rover's share of the European automotive market from 2000 to 2019* [Graph]. In Statista. Retrieved June 05, 2023, from https://www.statista.com/statistics/387295/land-rover-yearly-market-share-in-europe/
CarSalesBase. "Land Rover's share of the European automotive market from 2000 to 2019*." Chart. January 30, 2020. Statista. Accessed June 05, 2023. https://www.statista.com/statistics/387295/land-rover-yearly-market-share-in-europe/
CarSalesBase. (2020). Land Rover's share of the European automotive market from 2000 to 2019*. Statista. Statista Inc.. Accessed: June 05, 2023. https://www.statista.com/statistics/387295/land-rover-yearly-market-share-in-europe/
CarSalesBase. "Land Rover's Share of The European Automotive Market from 2000 to 2019*." Statista, Statista Inc., 30 Jan 2020, https://www.statista.com/statistics/387295/land-rover-yearly-market-share-in-europe/
CarSalesBase, Land Rover's share of the European automotive market from 2000 to 2019* Statista, https://www.statista.com/statistics/387295/land-rover-yearly-market-share-in-europe/ (last visited June 05, 2023)
Land Rover's share of the European automotive market from 2000 to 2019* [Graph], CarSalesBase, January 30, 2020. [Online]. Available: https://www.statista.com/statistics/387295/land-rover-yearly-market-share-in-europe/