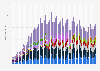
This statistic shows the usage of new technology at home in the United Kingdom (UK) in 2014 and 2015, by product type. In 2014, an estimated 7.6 million people used digital photo frame in their home in the UK.
Number of people using new technology at home in the United Kingdom (UK) in 2014 and 2015, by product type (in 1,000)
Basic Account
Get to know the platform
You only have access to basic statistics.
This statistic is not included in your account.
Starter Account
The ideal entry-level account for individual users
- Instant access to 1m statistics
- Download in XLS, PDF & PNG format
- Detailed references
$199 USD / Month *
Professional Account
Full access
Business Solutions including all features.
* Prices do not include sales tax.
Other statistics that may interest you Statistics on
About the industry
7
- Premium Statistic Smart TV ownership in homes in Great Britain 2014-2020
- Premium Statistic Home cinema usage in the United Kingdom (UK) 2014-2016
- Premium Statistic Batteries usage in the United Kingdom (UK) in 2014, by product type
- Premium Statistic Leading 'Batteries (Incl Rechargables)' brands in GB 2016 - 2022, by number of users
- Premium Statistic Supermarket brands of batteries in Great Britain 2013-2020, by number of users
- Premium Statistic Leading e-book readers in Great Britain 2013-2020, by number of users
- Premium Statistic Digital music/video players usage in France 2016, by feature
About the region
10
- Premium Statistic Number of home TV sets in Great Britain in 2021
- Premium Statistic TV sets usage in homes in Great Britain 2021, by screen size
- Premium Statistic TV sets usage in homes in Great Britain 2021, by screen type
- Premium Statistic TV sets usage in homes in Great Britain 2021, by special feature
- Premium Statistic 'Rum (White, Dark, Golden Or Flavoured/Spiced)' consumption in GB 2021, by type
- Premium Statistic Frequency of consumers of 'Vodka' in GB 2020 - 2022
- Premium Statistic 'Headphones / Earphones' usage in GB 2019 - 2022, by type
- Premium Statistic Gin usage in Great Britain 2013-2019, by user type
- Premium Statistic TV sets usage in homes in Great Britain 2014-2018, by room
- Premium Statistic Port usage in Great Britain 2013-2019, by user type
Selected statistics
1
Other regions
9
- Premium Statistic Leading 'Fruit Squashes & Cordials' brands in FR 2016 - 2022, by number of consumers
- Premium Statistic Most used forms of cream cheese in the U.S. 2020
- Premium Statistic Share of households buying fresh meal kits in the Netherlands 2017-2018
- Premium Statistic Number of households with HDTV in Germany 2022, by reception channel
- Premium Statistic Purchase of sports wear in China in 2012, by brand origin
- Basic Statistic Users of leading social network sites APAC 2013 by country or region
- Premium Statistic Italy: television usage among internet users 2017, by fruition type
- Premium Statistic Rapeseed oil for EU biodiesel production: projection 2025
- Premium Statistic Share of Flemish people with a flatscreen in their household in Belgium 2009-2018
Related statistics
2
Further related statistics
10
- Coal consumption in South Africa 1998-2022
- Area of organic farming worldwide 2000-2022
- Import volume of cobalt in the U.S. 2010-2023
- Primary energy consumption in Brazil 2009-2022
- Primary energy consumption in Germany 1998-2022
- Primary energy consumption in Asia Pacific 2022
- Primary energy consumption change in China 2000-2022
- Global primary energy consumption 2022, by country
- Primary energy consumption in South Korea 2021-2022, by fuel
- Primary energy consumption in OECD countries 2019-2022, by fuel type
Further Content: You might find this interesting as well
Statistics
- Coal consumption in South Africa 1998-2022
- Area of organic farming worldwide 2000-2022
- Import volume of cobalt in the U.S. 2010-2023
- Primary energy consumption in Brazil 2009-2022
- Primary energy consumption in Germany 1998-2022
- Primary energy consumption in Asia Pacific 2022
- Primary energy consumption change in China 2000-2022
- Global primary energy consumption 2022, by country
- Primary energy consumption in South Korea 2021-2022, by fuel
- Primary energy consumption in OECD countries 2019-2022, by fuel type
Kantar. (May 20, 2016). Number of people using new technology at home in the United Kingdom (UK) in 2014 and 2015, by product type (in 1,000) [Graph]. In Statista. Retrieved April 25, 2024, from https://www.statista.com/statistics/438114/new-technology-usage-by-type-in-the-uk/
Kantar. "Number of people using new technology at home in the United Kingdom (UK) in 2014 and 2015, by product type (in 1,000)." Chart. May 20, 2016. Statista. Accessed April 25, 2024. https://www.statista.com/statistics/438114/new-technology-usage-by-type-in-the-uk/
Kantar. (2016). Number of people using new technology at home in the United Kingdom (UK) in 2014 and 2015, by product type (in 1,000). Statista. Statista Inc.. Accessed: April 25, 2024. https://www.statista.com/statistics/438114/new-technology-usage-by-type-in-the-uk/
Kantar. "Number of People Using New Technology at Home in The United Kingdom (Uk) in 2014 and 2015, by Product Type (in 1,000)." Statista, Statista Inc., 20 May 2016, https://www.statista.com/statistics/438114/new-technology-usage-by-type-in-the-uk/
Kantar, Number of people using new technology at home in the United Kingdom (UK) in 2014 and 2015, by product type (in 1,000) Statista, https://www.statista.com/statistics/438114/new-technology-usage-by-type-in-the-uk/ (last visited April 25, 2024)
Number of people using new technology at home in the United Kingdom (UK) in 2014 and 2015, by product type (in 1,000) [Graph], Kantar, May 20, 2016. [Online]. Available: https://www.statista.com/statistics/438114/new-technology-usage-by-type-in-the-uk/