This statistic shows the usage of washing powders & tablets in France from 2014 to 2018, by specialist type. In 2018, an estimated 1.8 million people used organic or eco-friendly washing powders & tablets in France.
Number of people using washing powders & tablets in France from 2014 to 2018, by specialist type (in 1,000s)
Basic Account
Get to know the platform
You only have access to basic statistics.
This statistic is not included in your account.
Starter Account
The ideal entry-level account for individual users
- Instant access to 1m statistics
- Download in XLS, PDF & PNG format
- Detailed references
$199 USD / Month *
Professional Account
Full access
Business Solutions including all features.
* Prices do not include sales tax.
Other statistics that may interest you Statistics on
About the industry
9
- Premium Statistic Washing powders & tablet usage in Great Britain 2014-2018, by specialist type
- Premium Statistic 
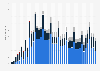
Washing powder & tablet usage in France 2014-2018, by type
- Premium Statistic Fabric conditioner usage in France 2014-2021, by type
- Premium Statistic 'Fabric Conditioners' usage in GB 2016 - 2022, by type
- Premium Statistic 'Air Fresheners, Scented Candles And Fabric Fresheners' usage in FR 2021, by type
- Premium Statistic 'Fabric Conditioners' usage in FR 2021, by type
- Premium Statistic Scented product usage in France 2014-2020, by user type
- Premium Statistic Furniture polish & duster usage in France 2014-2020, by type
- Premium Statistic Frequency of scented products usage in Great Britain 2016-2020
About the region
10
- Premium Statistic Air freshener usage in France in 2014-2020, by brand type
- Premium Statistic Flooring product, cleaner, wax and wipe usage in France 2014-2017, by type
- Premium Statistic Frequency of textile freshener usage in France 2014-2018
- Premium Statistic Leading disposable floor wipe and cloth brands in France 2014-16, by number of users
- Premium Statistic Frequency of liquid detergents for fabrics usage in France 2014-2018
- Premium Statistic Leading liquid, wax & paste cleaner brands in France 2019, by number of users
- Premium Statistic Household cleaner usage in France 2021, by type
- Premium Statistic 'Oral Care Products (Excluding Toothpaste)' usage in FR 2021, by type
- Premium Statistic 'Meat And Poultry (Uncooked)' consumption in FR 2021, by type
- Premium Statistic Frequency of female users of 'Feminine Hygiene Products' in FR 2016 - 2021
Other regions
9
- Premium Statistic Washing powder & tablet usage in Great Britain 2013-2019, by type
- Premium Statistic Acrylic fabrics consumption volume in Japan 2013-2022
- Premium Statistic Amount of canned, jarred or packaged fruit consumed in the U.S. 2020
- Basic Statistic Canada: number of Facebook users 2018-2027
- Premium Statistic The purchase of clothing in China by brand origin 2012
- Premium Statistic Middle East and Africa: number of social network users in the 2012-2018
- Premium Statistic European Union (EU-28): textile exports by product 2018
- Premium Statistic Share of respondents cannabis use in Sweden 2018, by gender and age group
- Premium Statistic North American and European demand for polyethylene terephthalate 2010-2030
Related statistics
7
- Premium Statistic Frequency of liquid detergents for fabrics usage in Great Britain 2015-2018
- Premium Statistic Liquid detergents for fabrics usage in Great Britain 2014-2018, by specialist type
- Premium Statistic Frequency of stain remover usage in the United Kingdom (UK) 2014-2016
- Premium Statistic Frequency of female users of 'Tampons' in GB 2021
- Premium Statistic Frequency of consumers of 'Gin' in GB 2020 - 2022
- Premium Statistic Leading brands of champagne in Great Britain 2022, by number of consumers
- Premium Statistic Leading cigarette brands of JPS in Great Britain 2016-2022, by number of consumers
Further related statistics
10
- Coal consumption in South Africa 1998-2022
- Area of organic farming worldwide 2000-2022
- Import volume of cobalt in the U.S. 2010-2023
- Coal consumption volume in China 1998-2022
- Poland - coal consumption in oil equivalent 2009-2022
- Primary energy consumption in Brazil 2009-2022
- Primary energy consumption in Germany 1998-2022
- Primary energy consumption in Asia Pacific 2022
- Primary energy consumption change in China 2000-2022
- Global primary energy consumption 2022, by country
Further Content: You might find this interesting as well
Statistics
- Coal consumption in South Africa 1998-2022
- Area of organic farming worldwide 2000-2022
- Import volume of cobalt in the U.S. 2010-2023
- Coal consumption volume in China 1998-2022
- Poland - coal consumption in oil equivalent 2009-2022
- Primary energy consumption in Brazil 2009-2022
- Primary energy consumption in Germany 1998-2022
- Primary energy consumption in Asia Pacific 2022
- Primary energy consumption change in China 2000-2022
- Global primary energy consumption 2022, by country
Kantar. (June 9, 2020). Number of people using washing powders & tablets in France from 2014 to 2018, by specialist type (in 1,000s) [Graph]. In Statista. Retrieved April 19, 2024, from https://www.statista.com/statistics/438586/washing-powder-and-tablet-usage-by-specialist-type-in-france/
Kantar. "Number of people using washing powders & tablets in France from 2014 to 2018, by specialist type (in 1,000s)." Chart. June 9, 2020. Statista. Accessed April 19, 2024. https://www.statista.com/statistics/438586/washing-powder-and-tablet-usage-by-specialist-type-in-france/
Kantar. (2020). Number of people using washing powders & tablets in France from 2014 to 2018, by specialist type (in 1,000s). Statista. Statista Inc.. Accessed: April 19, 2024. https://www.statista.com/statistics/438586/washing-powder-and-tablet-usage-by-specialist-type-in-france/
Kantar. "Number of People Using Washing Powders & Tablets in France from 2014 to 2018, by Specialist Type (in 1,000s)." Statista, Statista Inc., 9 Jun 2020, https://www.statista.com/statistics/438586/washing-powder-and-tablet-usage-by-specialist-type-in-france/
Kantar, Number of people using washing powders & tablets in France from 2014 to 2018, by specialist type (in 1,000s) Statista, https://www.statista.com/statistics/438586/washing-powder-and-tablet-usage-by-specialist-type-in-france/ (last visited April 19, 2024)
Number of people using washing powders & tablets in France from 2014 to 2018, by specialist type (in 1,000s) [Graph], Kantar, June 9, 2020. [Online]. Available: https://www.statista.com/statistics/438586/washing-powder-and-tablet-usage-by-specialist-type-in-france/