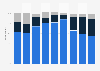
This statistic displays the leading reasons why consumers marketing e-mails as spam in the United Kingdom (UK) from 2013 to 2016. During the survey in 2016, it was found that 41 percent of respondents reported not recognizing the sender as a main reason for marking promotional e-mails as spam .
Leading reasons why consumers marking e-mails as spam in the United Kingdom (UK) between 2013 and 2016
Basic Account
Get to know the platform
You only have access to basic statistics.
This statistic is not included in your account.
Starter Account
The ideal entry-level account for individual users
- Instant access to 1m statistics
- Download in XLS, PDF & PNG format
- Detailed references
$229 USD $199 USD / Month *
in the first 12 months
Professional Account
Full access
Business Solutions including all features.
* Prices do not include sales tax.
Other statistics that may interest you Statistics on
About the industry
10
- Premium Statistic Opening rate of newsletters by industry in Italy 2020, by B2C sector
- Premium Statistic Click-to-open rate of DEM e-mails 2020 in Italy, by B2C industry
- Premium Statistic Click-to-open rate of newsletters in Italy 2020, by B2C industry
- Premium Statistic Click-through rate of DEM e-mails in Italy 2020, by B2C industry
- Premium Statistic Click-through rate of newsletters in Italy 2020, by B2C industry
- Premium Statistic Average opening rate of marketing e-mails in Italy 2019-2020
- Premium Statistic Opening rate of DEM e-mails in Italy 2020, by B2C industry
- Premium Statistic Average click-through rate of marketing e-mails in Italy 2019-2020
- Premium Statistic Message types encouraging consumers to sign up for emails in the UK 2021
- Basic Statistic Canada marketing e-mail mean unique open rates 2013-2018
About the region
10
- Premium Statistic Usage of different email addresses in the United Kingdom (UK) 2013-2017
- Premium Statistic Percentage of households with internet access in the United Kingdom 2013-2028
- Basic Statistic Grocery purchase and delivery methods in the United Kingdom (UK) 2015
- Premium Statistic Mobile internet usage reach in the United Kingdom 2019-2028
- Premium Statistic Average daily media use time in the United Kingdom (UK) 2022
- Premium Statistic Active social media users in the United Kingdom (UK) 2023
- Basic Statistic Internet penetration in the United Kingdom (UK) 2002-2023
- Basic Statistic Use of selected online security and safety features in the UK 2021
- Basic Statistic Online security and safety features usage at home in the UK 2016-2021
- Premium Statistic E-mail marketing click-through rate in the UK 2021, by sector
Selected statistics
2
Other regions
10
- Premium Statistic Online user penetration in China H1 2023, by activity
- Premium Statistic Number of newsletters to which people subscribed in France 2017
- Premium Statistic Amazon Prime features used by online shoppers in the U.S. 2020
- Basic Statistic Online purchasing penetration in Great Britain 2008-2020
- Premium Statistic E-mail inbox placement rate worldwide 2018, by industry
- Premium Statistic Preferred digital communication methods in Poland 2016-2018
- Premium Statistic E-mail inbox placement & spam rate in Brazil 2015-2016
- Basic Statistic Indonesia: netizen online shopping payment methods 2013
- Premium Statistic Household internet penetration in Latin America and the Caribbean 2020, by country
- Premium Statistic Number of cable modem internet subscribers in Russia 2012-2021
Related statistics
10
- Premium Statistic Ad spending of the digital advertising industry in the U.S. 2018-2027
- Premium Statistic E-mail marketing click-to-open rate in Great Britain 2021-2022
- Premium Statistic E-mail marketing unsubscribe rate in Great Britain 2021-2022
- Premium Statistic E-mail marketing open rate in Great Britain 2021-2022
- Premium Statistic E-mail marketing CTR in Great Britain 2021-2022
- Premium Statistic E-mail marketing bounce rate in Great Britain 2021-2022
- Premium Statistic E-mail click-to-open rate in the UK 2021, by sector
- Premium Statistic Email marketing unsubscribe rates in the UK 2021, by industry
- Premium Statistic E-mail marketing open rates in the UK 2021, by sector
- Premium Statistic Digital marketing use in the Sweden 2020, by channel
Further related statistics
10
- E-mail messaging penetration in Great Britain 2007-2020
- Households with internet access in GB from 2014 to 2020, by household composition
- Mobile internet use via laptops in Great Britain 2019, by demographic
- Use of smartphones by shoppers in retail stores in Italy in 2015
- Leading online retailers in Southeast Asia 2020, by monthly visits
- Daily internet use penetration in Great Britain 2006-2020
- Consumer electronics: Online purchasing in Great Britain 2020, by demographic
- Hours of internet use per week in the United Kingdom (UK) 2005-2019, by location
- Internet usage on a mobile phone in Great Britain 2010-2019, by age
- User numbers of microblogs in China 2010-2018
Further Content: You might find this interesting as well
Statistics
- E-mail messaging penetration in Great Britain 2007-2020
- Households with internet access in GB from 2014 to 2020, by household composition
- Mobile internet use via laptops in Great Britain 2019, by demographic
- Use of smartphones by shoppers in retail stores in Italy in 2015
- Leading online retailers in Southeast Asia 2020, by monthly visits
- Daily internet use penetration in Great Britain 2006-2020
- Consumer electronics: Online purchasing in Great Britain 2020, by demographic
- Hours of internet use per week in the United Kingdom (UK) 2005-2019, by location
- Internet usage on a mobile phone in Great Britain 2010-2019, by age
- User numbers of microblogs in China 2010-2018
UK DMA. (November 24, 2016). Leading reasons why consumers marking e-mails as spam in the United Kingdom (UK) between 2013 and 2016 [Graph]. In Statista. Retrieved October 04, 2023, from https://www.statista.com/statistics/457673/reasons-why-consumers-mark-promotional-e-mails-as-spam-in-the-uk/
UK DMA. "Leading reasons why consumers marking e-mails as spam in the United Kingdom (UK) between 2013 and 2016." Chart. November 24, 2016. Statista. Accessed October 04, 2023. https://www.statista.com/statistics/457673/reasons-why-consumers-mark-promotional-e-mails-as-spam-in-the-uk/
UK DMA. (2016). Leading reasons why consumers marking e-mails as spam in the United Kingdom (UK) between 2013 and 2016. Statista. Statista Inc.. Accessed: October 04, 2023. https://www.statista.com/statistics/457673/reasons-why-consumers-mark-promotional-e-mails-as-spam-in-the-uk/
UK DMA. "Leading Reasons Why Consumers Marking E-mails as Spam in The United Kingdom (Uk) between 2013 and 2016." Statista, Statista Inc., 24 Nov 2016, https://www.statista.com/statistics/457673/reasons-why-consumers-mark-promotional-e-mails-as-spam-in-the-uk/
UK DMA, Leading reasons why consumers marking e-mails as spam in the United Kingdom (UK) between 2013 and 2016 Statista, https://www.statista.com/statistics/457673/reasons-why-consumers-mark-promotional-e-mails-as-spam-in-the-uk/ (last visited October 04, 2023)
Leading reasons why consumers marking e-mails as spam in the United Kingdom (UK) between 2013 and 2016 [Graph], UK DMA, November 24, 2016. [Online]. Available: https://www.statista.com/statistics/457673/reasons-why-consumers-mark-promotional-e-mails-as-spam-in-the-uk/