This statistic shows the gross added value of the low emission vehicles sector in the United Kingdom (UK) from 2010 to 2013. Growth remained flat from 2010 to 2011 but steadily increased in the following two years.
Gross value added (GVA) by the low emissions vehicle sector in the United Kingdom (UK) 2010 to 2013 (in million GBP)
Loading statistic...
Basic Account
Get to know the platform
You only have access to basic statistics.
Single Account
The ideal entry-level account for individual users
- Instant access to 1m statistics
- Download in XLS, PDF & PNG format
- Detailed references
$59 $39 / Month *
in the first 12 months
Corporate Account
Full access
Corporate solution including all features.
* Prices do not include sales tax.
Further Content: You might find this interesting as well
Statistics
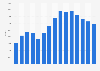
- GVA by the low emission vehicles sector in the United Kingdom (UK) from 2010 to 2013
- Employment in low emission vehicle sector in the United Kingdom (UK) 2010-2013
- GVA by the low carbon heat sector in the UK from 2010-2013
- GVA by the waste processing and bio-energy sector in the UK from 2010 to 2013
- Turnover of the low carbon heat sectorin the UK from 2010 to 2013
- GVA by the energy efficiency products sector in the UK from 2010 to 2013
- Turnover of low carbon electricity sector in the United Kingdom (UK) from 2010-2013
- Employment in the low emissions vehicles sector in the UK from 2010 to 2013
- GVA history by the biomass equipment industry in the United Kingdom (UK) 2013
- Low carbon electricity sector GVA in the United Kingdom (UK) from 2010 to 2013
- Employment in the bioenergy/waste processing sector in the UK from 2010-2013
- Employment distribution in the low carbon electricity sector in the UK 2013
- Turnover of the low emission vehicles sector in the UK from 2010-2013
- Employment in the low carbon services in the UNited Kingdom (UK) from 2010-2013
- Employment distribution the low emission vehicles sector in the UK by country 2013
- Number of band I cars (176-185g/km CO2 emission) in Great Britain (UK) 2001-2017
- Share of cars in band C (111-120 g/km CO2 emission) in Great Britain (UK) 2001-2017
- Share of cars with 201-225g/km CO2 emissions in Great Britain 2001-2017
- Average CO2 car emission levels across EU-28 in 2016
Department for Business, Innovation and Skills. (March 2, 2015). Gross value added (GVA) by the low emissions vehicle sector in the United Kingdom (UK) 2010 to 2013 (in million GBP) [Graph]. In Statista. Retrieved January 21, 2021, from https://www.statista.com/statistics/468098/gva-low-emission-vehicles-uk/
Department for Business, Innovation and Skills. "Gross value added (GVA) by the low emissions vehicle sector in the United Kingdom (UK) 2010 to 2013 (in million GBP)." Chart. March 2, 2015. Statista. Accessed January 21, 2021. https://www.statista.com/statistics/468098/gva-low-emission-vehicles-uk/
Department for Business, Innovation and Skills. (2015). Gross value added (GVA) by the low emissions vehicle sector in the United Kingdom (UK) 2010 to 2013 (in million GBP). Statista. Statista Inc.. Accessed: January 21, 2021. https://www.statista.com/statistics/468098/gva-low-emission-vehicles-uk/
Department for Business, Innovation and Skills. "Gross Value Added (Gva) by The Low Emissions Vehicle Sector in The United Kingdom (Uk) 2010 to 2013 (in Million Gbp)." Statista, Statista Inc., 2 Mar 2015, https://www.statista.com/statistics/468098/gva-low-emission-vehicles-uk/
Department for Business, Innovation and Skills, Gross value added (GVA) by the low emissions vehicle sector in the United Kingdom (UK) 2010 to 2013 (in million GBP) Statista, https://www.statista.com/statistics/468098/gva-low-emission-vehicles-uk/ (last visited January 21, 2021)