

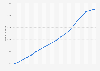


Time spent on social and communications activities daily among 16-24s in the UK 2014
This statistic displays the time spent on social and communications activities daily among 16 to 24 year-olds in the United Kingdom (UK) in 2014. Individuals aged between 16 and 24 in the UK spent 1 hour and 6 minutes on average on social networking sites.


