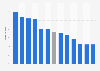
This statistic illustrates the number of properties viewed by homeowners in the United Kingdom (UK) before putting an offer on their current home in 2015. It can be seen that the highest number of properties viewed was between one and three properties, with 30 percent of homeowners reporting that. Further 25 percent viewed between four and six properties, or did not view any and made an offer on the first property they saw.
Number of properties viewed by homeowners before putting in an offer on their current home in the United Kingdom (UK) 2015
Loading statistic...
Basic Account
Get to know the platform
You only have access to basic statistics.
Single Account
The ideal entry-level account for individual users
- Instant access to 1m statistics
- Download in XLS, PDF & PNG format
- Detailed references
$59 $39 / Month *
in the first 12 months
Corporate Account
Full access
Corporate solution including all features.
* Prices do not include sales tax.
Further Content: You might find this interesting as well
Statistics
- Properties that homeowners liked but could not buy in the United Kingdom (UK) 2015
- Property purchase intentions in China by income group 2013
- Value of property purchases by property companies in the UK 2005-2014
- Value of property purchases by financial institutions in the UK 2005-2014
- Value of property purchase transactions in the UK 2005-2014
- Number of property exchanges in the United Kingdom Q3 2018, by region
- Origin of major foreign buyers of U.S. residential property in 2021
- Budget strain for better neighborhood vs. living within budget U.S. 2017, by mortgage
- Amount of down payment people believe is needed for a mortgage U.S. 2017, by age
- Amount of down payment people believe is reasonable for a mortgage U.S. 2017, by area
- Italy: attitudes towards buying houses 2017
- Share of adults who think overspending on homes is a problem U.S. 2017, by region
Economic Voice. (December 4, 2015). Number of properties viewed by homeowners before putting in an offer on their current home in the United Kingdom (UK) 2015 [Graph]. In Statista. Retrieved May 20, 2022, from https://www.statista.com/statistics/506090/number-properties-viewed-homeowners-before-putting-offer-united-kingdom/
Economic Voice. "Number of properties viewed by homeowners before putting in an offer on their current home in the United Kingdom (UK) 2015." Chart. December 4, 2015. Statista. Accessed May 20, 2022. https://www.statista.com/statistics/506090/number-properties-viewed-homeowners-before-putting-offer-united-kingdom/
Economic Voice. (2015). Number of properties viewed by homeowners before putting in an offer on their current home in the United Kingdom (UK) 2015. Statista. Statista Inc.. Accessed: May 20, 2022. https://www.statista.com/statistics/506090/number-properties-viewed-homeowners-before-putting-offer-united-kingdom/
Economic Voice. "Number of Properties Viewed by Homeowners before Putting in An Offer on Their Current Home in The United Kingdom (Uk) 2015." Statista, Statista Inc., 4 Dec 2015, https://www.statista.com/statistics/506090/number-properties-viewed-homeowners-before-putting-offer-united-kingdom/
Economic Voice, Number of properties viewed by homeowners before putting in an offer on their current home in the United Kingdom (UK) 2015 Statista, https://www.statista.com/statistics/506090/number-properties-viewed-homeowners-before-putting-offer-united-kingdom/ (last visited May 20, 2022)