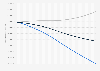
This statistic shows a forecast of the demographic pressure in the Netherlands in births and deaths from 2015 to 2055. It reveals that the number of live births is expected to grow from 178,000 in 2015 to 191,000 in 2055, with a slight decrease between 2030 and 2045. The number of deaths is expected to increase from 142,000 in 2015 to 202,000 in 2055. It also shows that in 2015 the number of live births was roughly 36,000 higher than the number of deaths. By 2055 it is likely that the number of death outnumber the number of live births by roughly 10,000.
Forecast of the demographic pressure in the Netherlands in births and deaths from 2015 to 2055
Loading statistic...
Basic Account
Get to know the platform
You only have access to basic statistics.
Starter Account
The ideal entry-level account for individual users
- Instant access to 1m statistics
- Download in XLS, PDF & PNG format
- Detailed references
$199 USD / Month *
Professional Account
Full access
Business Solutions including all features.
* Prices do not include sales tax.
Other statistics that may interest you Statistics on
About the industry
10
- Basic Statistic Age structure in Argentina 2022
- Basic Statistic Age structure in Denmark 2022
- Basic Statistic Urbanization in China 2022
- Premium Statistic Sex ratio in China 1953-2023
- Basic Statistic Total number of live births in the Netherlands 2008-2022
- Premium Statistic France: leading nationalities of expats 2018
- Premium Statistic French expats: leading countries of residence 2018
- Premium Statistic Live birth figures in Greece 2007-2016
- Premium Statistic Proportion of population aged 25-64 years in employment in the UK 2011-2015
- Basic Statistic Forecast life expectancy at birth the Netherlands 2015-2060
About the region
10
- Basic Statistic Age distribution in the Netherlands 2012-2022
- Premium Statistic Death rate in the Netherlands 2021
- Basic Statistic Population growth in the Netherlands 2022
- Basic Statistic Netherlands: population density 2007-2023
- Basic Statistic Total population of the Netherlands 1950-2023
- Basic Statistic Forecast number of live births in the Netherlands 2017-2055
- Basic Statistic Forecast net migration balance in the Netherlands 2015-2055
- Basic Statistic Fertility rate in the Netherlands 2021
- Basic Statistic Population of Bonaire (Caribbean Netherlands) 2011-2023, by gender
- Basic Statistic Population of Sint Eustatius (Caribbean Netherlands) 2011-2023, by gender
Selected statistics
4
- Basic Statistic Percentage of U.S. population groups with a bachelor's degree, by ethnicity 2010
- Basic Statistic Change in U.S. Chinese population from 1980 to 2010
- Basic Statistic Change in foreign-born Chinese-American population from 1980 to 2010
- Basic Statistic Share of women in developing countries who were married before the age of 15
Other regions
10
- Basic Statistic Number of births in Finland 2022, by age of mother
- Basic Statistic Number of live births from mothers born in the Middle East and Asia 2008-2018
- Premium Statistic Number of live births in Kuwait 2012-2020, by nationality
- Basic Statistic Urbanization in Chile 2022
- Basic Statistic Urbanization in Pakistan 2022
- Basic Statistic Urbanization in Ghana 2022
- Basic Statistic Urbanization in Ukraine 2022
- Basic Statistic Urbanization in Colombia 2022
- Basic Statistic Urbanization in Slovakia 2022
- Basic Statistic Urbanization in Kenya 2022
Related statistics
9
- Basic Statistic Total population of Belgium 2009-2023
- Basic Statistic Fertility rate in Luxembourg 2022, by age group
- Basic Statistic Total population of Luxembourg 2001-2023
- Basic Statistic Population of the Caribbean Netherlands 2023, by municipality
- Basic Statistic Population of the Caribbean Netherlands 2011-2023, by gender
- Basic Statistic Population of Saba (Caribbean Netherlands) 2011-2023, by gender
- Premium Statistic Percentage change of the population in the Netherlands 2019-2024
- Basic Statistic Total number of births, deaths and birth excess in the Netherlands 2008-2022
- Basic Statistic Demographic pressure the Netherlands 1950-2023
Further related statistics
9
- Deaths by motor vehicle-related injuries in the U.S. 1930-2022
- Deaths by prostate cancer in the U.S. 1950-2019
- Total population of Myanmar in 2014, by gender
- Cancer mortality rate among men 2003-2007 by country
- Employment to population ratio in 2012, by region and gender
- Regional shares of global population, food-insecurity and distribition gap 2012
- Largest Colombian-American population groups in the U.S., by county 2010
- Largest Honduran-American population groups in the U.S., by county 2010
- Mean annual decline in maternal mortality 1990-2010 by world region
Further Content: You might find this interesting as well
Statistics
- Deaths by motor vehicle-related injuries in the U.S. 1930-2022
- Deaths by prostate cancer in the U.S. 1950-2019
- Total population of Myanmar in 2014, by gender
- Cancer mortality rate among men 2003-2007 by country
- Employment to population ratio in 2012, by region and gender
- Regional shares of global population, food-insecurity and distribition gap 2012
- Largest Colombian-American population groups in the U.S., by county 2010
- Largest Honduran-American population groups in the U.S., by county 2010
- Mean annual decline in maternal mortality 1990-2010 by world region
Centraal Bureau voor de Statistiek. (December 18, 2014). Forecast of the demographic pressure in the Netherlands in births and deaths from 2015 to 2055 [Graph]. In Statista. Retrieved April 19, 2024, from https://www.statista.com/statistics/523856/netherlands-demographic-pressure-forecast-births-and-deaths-2015-2055/
Centraal Bureau voor de Statistiek. "Forecast of the demographic pressure in the Netherlands in births and deaths from 2015 to 2055." Chart. December 18, 2014. Statista. Accessed April 19, 2024. https://www.statista.com/statistics/523856/netherlands-demographic-pressure-forecast-births-and-deaths-2015-2055/
Centraal Bureau voor de Statistiek. (2014). Forecast of the demographic pressure in the Netherlands in births and deaths from 2015 to 2055. Statista. Statista Inc.. Accessed: April 19, 2024. https://www.statista.com/statistics/523856/netherlands-demographic-pressure-forecast-births-and-deaths-2015-2055/
Centraal Bureau voor de Statistiek. "Forecast of The Demographic Pressure in The Netherlands in Births and Deaths from 2015 to 2055." Statista, Statista Inc., 18 Dec 2014, https://www.statista.com/statistics/523856/netherlands-demographic-pressure-forecast-births-and-deaths-2015-2055/
Centraal Bureau voor de Statistiek, Forecast of the demographic pressure in the Netherlands in births and deaths from 2015 to 2055 Statista, https://www.statista.com/statistics/523856/netherlands-demographic-pressure-forecast-births-and-deaths-2015-2055/ (last visited April 19, 2024)
Forecast of the demographic pressure in the Netherlands in births and deaths from 2015 to 2055 [Graph], Centraal Bureau voor de Statistiek, December 18, 2014. [Online]. Available: https://www.statista.com/statistics/523856/netherlands-demographic-pressure-forecast-births-and-deaths-2015-2055/