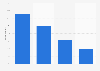
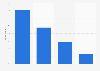
This statistic illustrates the share of total management consultancy turnover attributable to sales and marketing services in selected European countries in 2014 and 2017. It can be seen that the share of MC turnover attributable to sales & marketing services in Finland was highest, at 15 percent in 2017.
Share of total management consultancy turnover attributable to sales and marketing services in selected European countries in 2014 and 2017
Loading statistic...
Basic Account
Get to know the platform
You only have access to basic statistics.
Starter Account
The ideal entry-level account for individual users
- Instant access to 1m statistics
- Download in XLS, PDF & PNG format
- Detailed references
$69 USD $49 USD / Month *
in the first 12 months
Professional Account
Full access
Business Solutions including all features.
* Prices do not include sales tax.
Other statistics that may interest you
General
6
- Premium Statistic Time spent with media in the U.S. 2020, by age group
- Premium Statistic Most common media activities in the U.S. 2018, by age
- Premium Statistic Favorite media activities in the U.S. in 2018, by age group
- Premium Statistic Media use among LGBTQ consumers in the U.S. 2018, by generation
- Premium Statistic U.S. Millennials: consumer devices penetration by ethnicity 2018
- Premium Statistic Smart speaker user number among Millennials in the United States 2017-2018
TV and video
8
- Premium Statistic TV reach in the U.S. Q1 2019, by age
- Premium Statistic Weekly viewing of traditional TV in the U.S. 2018, by age group
- Premium Statistic U.S. weekly time spent on online video 2018, by age
- Premium Statistic U.S. weekly time spent on smartphone video 2018, by age group
- Premium Statistic U.S. TV consumption: daily viewing time 2009-2021, by age group
- Premium Statistic Millennials watching 3+ hours of TV and video daily in the U.S. 2018, by method
- Premium Statistic Video genres viewed in the last month among Millennials in the U.S. 2018, by device
- Premium Statistic Digital engagement of U.S. adults with TV shows 2018
Film
5
- Premium Statistic Number of movies seen in a theater in the U.S 2017-2021, by age group
- Premium Statistic U.S. frequent moviegoers 2017-2019, by age group
- Premium Statistic Frequency of going to the movies in the U.S. 2022, by age group
- Premium Statistic Movie review readers U.S. 2018, by age group
- Basic Statistic Favorite film genres in the U.S. 2018, by age group
Radio & audio
8
- Premium Statistic Online radio reach in the U.S. 2021, by age group
- Premium Statistic Radio reach in the U.S. in 2021, by age and gender
- Premium Statistic Leading radio formats of U.S. Millennials 2018
- Premium Statistic Radio listeners number in the U.S. in 2018, by demographic group
- Premium Statistic Consumers listening to the radio on a weekly basis U.S. 2020, by age group
- Premium Statistic Spotify users in the U.S. 2018, by age
- Premium Statistic Share of people who listen to podcasts monthly in the U.S. 2017-2022, by age group
- Premium Statistic Consumers listening to podcasts on a weekly basis U.S. 2020, by age group
Print
7
- Premium Statistic Print book readers in the U.S. 2021, by age group
- Basic Statistic Book readers in the U.S. 2019-2021, by age group
- Premium Statistic Number of print magazines read in the U.S. 2020, by ethnicity
- Premium Statistic Frequency of reading print newspapers by U.S. consumers 2017, by age group
- Premium Statistic Millennials poetry reading rate in the U.S. 2012-2017
- Premium Statistic Frequency of reading comics in the U.S. 2018, by age group
- Basic Statistic Consumers who use a Bible in the U.S. 2018, by age
News
8
- Premium Statistic Young adults' primary news sources in the U.S. 2017
- Basic Statistic News consumption frequency among millennials in the U.S. 2022, by source
- Basic Statistic Most popular news platforms in the U.S. 2022, by age group
- Premium Statistic Most used network for television news in the U.S.as of May 2018, by age
- Basic Statistic Frequency of cable news consumption in the U.S. 2022, by age group
- Premium Statistic Share of Millennial radio audience listening to news/talk radio in U.S. 2014-2018
- Premium Statistic Interactions with local journalists in the U.S. 2018, by age group
- Premium Statistic U.S. voters concerned about fake news influence on elections 2018, by age group
Gaming
5
- Premium Statistic Global gamer share worldwide in 2017, by age and gender
- Premium Statistic Share of paying gamers in the U.S. as of May 2018, by age and gender
- Basic Statistic U.S. video gaming audiences 2022, by age group
- Premium Statistic U.S. daily time spent playing games and leisure computer use 2019-2021, by age
- Premium Statistic Share of U.S. eSports fans 2022, by age
Subscription services
8
- Premium Statistic Streaming subscribers in the U.S. 2019, by service and generation
- Premium Statistic Netflix subscriptions in the U.S. 2021, by age group
- Premium Statistic Netflix subscribers among VoD users in the U.S. 2018, by age
- Premium Statistic Amazon Prime Video subscribers among VoD users in the U.S. 2018, by age
- Premium Statistic HBO Now/HBO Go subscriptions in the U.S. 2020, by age group
- Premium Statistic Hulu subscriptions in the U.S. 2021, by age group
- Premium Statistic Share of households streaming SVOD daily in the U.S. 2021, by age group
- Basic Statistic Streamers subscribed to as service due to a specific show U.S. 2019, by age group
Marketing & advertising
7
- Premium Statistic Opinions on online advertising relevance in the U.S. 2021-2023
- Premium Statistic Share of U.S. adults paying attention to commercials in 2019, by age
- Premium Statistic U.S. internet users negative attitude towards ads on websites 2018, by age group
- Premium Statistic U.S. internet users negative attitude towards ads in online videos 2018, by age group
- Premium Statistic Opinions of consumers about social media influencers in 2018, by age
- Premium Statistic Adblocking penetration rate in the U.S. Q2 2020, by age group
- Premium Statistic U.S. retailers marketing spend plans 2018, by generation
Social media
7
- Basic Statistic Facebook usage reach in the United States 2021, by age group
- Basic Statistic Instagram usage reach in the United States 2021, by age group
- Basic Statistic Twitter: usage reach in the United States 2021, by age group
- Basic Statistic Pinterest usage reach in the United States 2021, by age group
- Premium Statistic U.S. Facebook Messenger users 2023, by age group
- Premium Statistic U.S. Instagram users 2023, by age group
- Premium Statistic Twitter: distribution of U.S. users 2018, by age
Recreation and entertainment
6
- Basic Statistic Travel planning methods of Millennials in the U.S. as of July 2018
- Premium Statistic Websites visited on a regular basis for travel information by Millennials U.S. 2018
- Premium Statistic Information sources used by Millennials when searching for vacation ideas U.S. 2018
- Premium Statistic Sports content viewership in the U.S. 2020, by platform and age
- Premium Statistic Summer Olympics viewership intent in the U.S. 2021, by age
- Premium Statistic Film festival attendance among LGBTQ consumers in the U.S. 2018, by generation
Popular culture
8
- Premium Statistic Favorite Star Wars movie in the U.S. 2019, by age
- Premium Statistic Favorite James Bond films in the U.S. 2019, by generation
- Premium Statistic Adults who have never seen a James Bond film U.S. 2019, by generation
- Premium Statistic Favorite all-time TV shows among Millennials in the U.S. 2018
- Premium Statistic Contemporary TV shows with the highest ratings among Millennials in the U.S. 2018
- Basic Statistic Enjoyment of Game of Thrones TV series in the U.S. 2019, by generation
- Basic Statistic Familiarity with A Song of Fire and Ice book series in the U.S. 2019, by generation
- Premium Statistic Fans of Marvel Comics in the U.S. 2019, by age group
Further related statistics
17
- Turnover per professional in management consultancy in Europe 2013-2015, by firm size
- Financial services industry consultancy turnover share in European countries 2017
- Export outside EU market: management consultancy turnover share Europe 2016
- Management consultancy turnover growth rate in Greece 2013-2018
- Turnover per professional in management consultancy in Europe 2014/15
- Service distribution of management consultancy turnover in France 2014-2021
- Management consultancy turnover share of public administration Europe 2014-2017
- Management consultancy turnover distribution Europe 2017, by service sector
- Management consultancy turnover trend in the UK 2007-2015
- Consulting: people & change services turnover share in European countries 2017
- Management consultancy: manufacturing sector turnover share in Europe 2017
- Management consultancy turnover distribution Spain 2018, by service sector industry
- Finance & risk services consulting turnover share in European countries 2017
- Management consultancy turnover share in the service sector in Europe 2014-2017
- Management consultancy turnover growth rate in France 2013-2022
- Management consultancy turnover trend in Germany 2007-2016
- Business expectations in Romania 2021
Further Content: You might find this interesting as well
Statistics
- Turnover per professional in management consultancy in Europe 2013-2015, by firm size
- Financial services industry consultancy turnover share in European countries 2017
- Export outside EU market: management consultancy turnover share Europe 2016
- Management consultancy turnover growth rate in Greece 2013-2018
- Turnover per professional in management consultancy in Europe 2014/15
- Service distribution of management consultancy turnover in France 2014-2021
- Management consultancy turnover share of public administration Europe 2014-2017
- Management consultancy turnover distribution Europe 2017, by service sector
- Management consultancy turnover trend in the UK 2007-2015
- Consulting: people & change services turnover share in European countries 2017
- Management consultancy: manufacturing sector turnover share in Europe 2017
- Management consultancy turnover distribution Spain 2018, by service sector industry
- Finance & risk services consulting turnover share in European countries 2017
- Management consultancy turnover share in the service sector in Europe 2014-2017
- Management consultancy turnover growth rate in France 2013-2022
- Management consultancy turnover trend in Germany 2007-2016
- Business expectations in Romania 2021
FEACO. (December 1, 2018). Share of total management consultancy turnover attributable to sales and marketing services in selected European countries in 2014 and 2017 [Graph]. In Statista. Retrieved June 10, 2023, from https://www.statista.com/statistics/527348/turnover-share-of-management-consultancy-sales-marketing-europe/
FEACO. "Share of total management consultancy turnover attributable to sales and marketing services in selected European countries in 2014 and 2017." Chart. December 1, 2018. Statista. Accessed June 10, 2023. https://www.statista.com/statistics/527348/turnover-share-of-management-consultancy-sales-marketing-europe/
FEACO. (2018). Share of total management consultancy turnover attributable to sales and marketing services in selected European countries in 2014 and 2017. Statista. Statista Inc.. Accessed: June 10, 2023. https://www.statista.com/statistics/527348/turnover-share-of-management-consultancy-sales-marketing-europe/
FEACO. "Share of Total Management Consultancy Turnover Attributable to Sales and Marketing Services in Selected European Countries in 2014 and 2017." Statista, Statista Inc., 1 Dec 2018, https://www.statista.com/statistics/527348/turnover-share-of-management-consultancy-sales-marketing-europe/
FEACO, Share of total management consultancy turnover attributable to sales and marketing services in selected European countries in 2014 and 2017 Statista, https://www.statista.com/statistics/527348/turnover-share-of-management-consultancy-sales-marketing-europe/ (last visited June 10, 2023)
Share of total management consultancy turnover attributable to sales and marketing services in selected European countries in 2014 and 2017 [Graph], FEACO, December 1, 2018. [Online]. Available: https://www.statista.com/statistics/527348/turnover-share-of-management-consultancy-sales-marketing-europe/