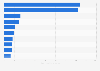
This statistic presents travel spending on business visits from the U.S. to the United Kingdom (UK) between 2010 and 2016, by gender. Spending by female business visitors peaked at 285 million British pounds in 2016. Spending by male visitors peaked 748.8 million British pounds in 2016.
Spending on business visits from the U.S. to the United Kingdom (UK) between 2010 and 2016, by gender (in million GBP)
Loading statistic...
Basic Account
Get to know the platform
You only have access to basic statistics.
Single Account
The ideal entry-level account for individual users
- Instant access to 1m statistics
- Download in XLS, PDF & PNG format
- Detailed references
$59 $39 / Month *
in the first 12 months
Corporate Account
Full access
Corporate solution including all features.
* Prices do not include sales tax.
Further Content: You might find this interesting as well
Statistics
- Spending on business visits from the Netherlands to the UK 2010-2017
- Business spending by male visitors from Portugal to the UK 2010-2017
- Spending on business visits from the U.S. to the UK 2010-2018
- Spending on business visits from Norway to the UK 2010-2017
- Spending on business visits from Hungary to the UK 2010-2017
- Spending on business visits from Norway to the UK 2010-2018, by gender
- Spending on business visits from Ireland to the UK 2010-2017
- Spending on business visits from France to the UK between 2010 and 2016, by gender
- Spending on business visits from Canada to the UK 2010-2017
- Spending by visitors from Canada in the UK 2010-2016, by gender
- Spending by visitors from Germany in the UK 2010-2016, by gender
- Spending by visitors from Portugal in the UK 2010-2016, by gender
- Spending by visitors from the U.S. in the UK 2010-2016, by gender
VisitBritain. (March 29, 2018). Spending on business visits from the U.S. to the United Kingdom (UK) between 2010 and 2016, by gender (in million GBP) [Graph]. In Statista. Retrieved January 26, 2021, from https://www.statista.com/statistics/528247/spend-on-business-visits-usa-to-united-kingdom-by-gender/
VisitBritain. "Spending on business visits from the U.S. to the United Kingdom (UK) between 2010 and 2016, by gender (in million GBP)." Chart. March 29, 2018. Statista. Accessed January 26, 2021. https://www.statista.com/statistics/528247/spend-on-business-visits-usa-to-united-kingdom-by-gender/
VisitBritain. (2018). Spending on business visits from the U.S. to the United Kingdom (UK) between 2010 and 2016, by gender (in million GBP). Statista. Statista Inc.. Accessed: January 26, 2021. https://www.statista.com/statistics/528247/spend-on-business-visits-usa-to-united-kingdom-by-gender/
VisitBritain. "Spending on Business Visits from The U.S. to The United Kingdom (Uk) between 2010 and 2016, by Gender (in Million Gbp)." Statista, Statista Inc., 29 Mar 2018, https://www.statista.com/statistics/528247/spend-on-business-visits-usa-to-united-kingdom-by-gender/
VisitBritain, Spending on business visits from the U.S. to the United Kingdom (UK) between 2010 and 2016, by gender (in million GBP) Statista, https://www.statista.com/statistics/528247/spend-on-business-visits-usa-to-united-kingdom-by-gender/ (last visited January 26, 2021)