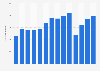
The statistic displayed above shows the quarterly revenue for culture and recreation in Belgium from the first quarter of 2014 to the fourth quarter of 2022. In the first quarter of 2014, the revenue stood at approximately 855 million euros. In the fourth quarter of 2022, the revenue was approximately 1.92 billion euros.
Quarterly revenue culture and recreation in Belgium from 1st quarter 2014 to 4th quarter 2022 (in thousand euros)
Loading statistic...
Basic Account
Get to know the platform
You only have access to basic statistics.
Starter Account
The ideal entry-level account for individual users
- Instant access to 1m statistics
- Download in XLS, PDF & PNG format
- Detailed references
$59 USD $39 USD / Month *
in the first 12 months
Professional Account
Full access
Business Solutions including all features.
* Prices do not include sales tax.
Statistics on Visitor attractions in the United Kingdom (UK)
Overview
7
- Premium Statistic Most visited tourist attractions in the UK 2019-2021
- Premium Statistic Growth rate of admissions to visitor attractions in England 2006-2021
- Premium Statistic Percentage change in tourist attraction admissions in England 2020-2021, by category
- Premium Statistic Percentage change in gross revenue of visitor attractions in England 2007-2021
- Premium Statistic Growth rate of visitor attractions' gross revenue in England 2021, by category
- Premium Statistic Average admission charge for visitor attractions in England 2021, by category
- Premium Statistic Share of visitor attractions communicating digitally in England 2020-2021, by channel
Leading attractions
8
- Basic Statistic Leading paid visitor attractions in England 2019-2021, by attendance
- Basic Statistic Leading free visitor attractions in England in 2019-2021, by attendance
- Basic Statistic Leading paid visitor attractions in London, UK 2019-2021, by attendance
- Basic Statistic Leading free visitor attractions in London, UK 2019-2021, by attendance
- Premium Statistic Leading paid visitor attractions in Scotland 2019-2022, by attendance
- Basic Statistic Leading free visitor attractions in Scotland 2019-2022, by attendance
- Basic Statistic Leading paid visitor attractions in Wales 2019-2021
- Basic Statistic Leading free visitor attractions in Wales 2019-2021
Museums and galleries
8
- Basic Statistic Revenue of museum activities in the United Kingdom (UK) 2008-2020
- Premium Statistic Number of museum enterprises in the UK 2019-2022, by revenue
- Premium Statistic Income from admissions of government funded museums in England 2019-2022, by museum
- Premium Statistic Number of visitors to government funded museums in England 2019-2022, by museum
- Premium Statistic Museum and gallery attendance frequency in England 2021-2022
- Premium Statistic Museum and gallery attendance in England 2021-2022, by age
- Premium Statistic Number of visitors to the British Museum in London, England 2011-2022
- Premium Statistic Number of visits to the National Museum of Scotland in the UK 2010-2022
Historic attractions
8
- Basic Statistic Revenue of historical visitor attractions operating in the UK 2008-2020
- Premium Statistic Number of historical visitor attractions operating in the UK 2008-2020
- Premium Statistic Most visited castles and historical monument sites in England 2019-2021
- Premium Statistic Types of heritage sites visited by adults in England 2020
- Premium Statistic Heritage site visitor frequency in England 2020
- Premium Statistic Number of visitors to English Heritage sites 2011-2022
- Premium Statistic Number of visits to the Tower of London in England 2010-2021
- Premium Statistic Number of visits to Stonehenge in England 2010-2021
Parks, zoos, and wildlife attractions
6
- Premium Statistic Royal tourism: admissions to Royal Estate in the United Kingdom 2015-2022
- Basic Statistic Royal tourism: admissions to Royal Estate in the UK 2019-2022, by establishment
- Basic Statistic National parks ranked by domestic visits in Great Britain 2016-2019
- Premium Statistic Leading zoos and wildlife attractions in England 2019-2021
- Premium Statistic Number of visits to the Chester Zoo in the UK 2010-2021
- Premium Statistic Number of visits to the ZSL London Zoo in the UK 2010-2021
Amusement parks
3
Further related statistics
9
- Recreation and cultural services quarterly expenditure in the UK 2015-2021
- GDP arts and recreation industry New Zealand 2014-2022
- Audience expenditure at entertainment events in Italy 2013-2020
- U.S. arts and culture organizations total expenditure 2010
- Number of establishments in arts and culture industries in the U.S. 2000-2013
- Opinions on art and collectibles being in wealth management offerings worldwide 2021
- Distribution of fine art auction revenue in China in 2016, by art price range
- Auction houses with the largest increase in global sales between 2007 and 2013
- Mexico: recreational toys production volume 2013-2021
Further Content: You might find this interesting as well
Statistics
- Recreation and cultural services quarterly expenditure in the UK 2015-2021
- GDP arts and recreation industry New Zealand 2014-2022
- Audience expenditure at entertainment events in Italy 2013-2020
- U.S. arts and culture organizations total expenditure 2010
- Number of establishments in arts and culture industries in the U.S. 2000-2013
- Opinions on art and collectibles being in wealth management offerings worldwide 2021
- Distribution of fine art auction revenue in China in 2016, by art price range
- Auction houses with the largest increase in global sales between 2007 and 2013
- Mexico: recreational toys production volume 2013-2021
Statbel. (March 1, 2023). Quarterly revenue culture and recreation in Belgium from 1st quarter 2014 to 4th quarter 2022 (in thousand euros) [Graph]. In Statista. Retrieved March 31, 2023, from https://www.statista.com/statistics/532920/quarterly-revenue-culture-and-recreation-in-belgium/
Statbel. "Quarterly revenue culture and recreation in Belgium from 1st quarter 2014 to 4th quarter 2022 (in thousand euros)." Chart. March 1, 2023. Statista. Accessed March 31, 2023. https://www.statista.com/statistics/532920/quarterly-revenue-culture-and-recreation-in-belgium/
Statbel. (2023). Quarterly revenue culture and recreation in Belgium from 1st quarter 2014 to 4th quarter 2022 (in thousand euros). Statista. Statista Inc.. Accessed: March 31, 2023. https://www.statista.com/statistics/532920/quarterly-revenue-culture-and-recreation-in-belgium/
Statbel. "Quarterly Revenue Culture and Recreation in Belgium from 1st Quarter 2014 to 4th Quarter 2022 (in Thousand Euros)." Statista, Statista Inc., 1 Mar 2023, https://www.statista.com/statistics/532920/quarterly-revenue-culture-and-recreation-in-belgium/
Statbel, Quarterly revenue culture and recreation in Belgium from 1st quarter 2014 to 4th quarter 2022 (in thousand euros) Statista, https://www.statista.com/statistics/532920/quarterly-revenue-culture-and-recreation-in-belgium/ (last visited March 31, 2023)
Quarterly revenue culture and recreation in Belgium from 1st quarter 2014 to 4th quarter 2022 (in thousand euros) [Graph], Statbel, March 1, 2023. [Online]. Available: https://www.statista.com/statistics/532920/quarterly-revenue-culture-and-recreation-in-belgium/