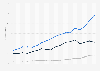
This source displays the total value of the capital services in the culture, sports and recreation sector in the Netherlands from 2004 to 2014 (in million euros). Between 2004 and 2014, the total value of the capital services in this sector varied between 1,029 and 1,396 million euros roughly.
Total value of the capital services in the culture, sports and recreation sector in the Netherlands from 2004 to 2014 (in million euros)
Loading statistic...
Basic Account
Get to know the platform
You only have access to basic statistics.
Starter Account
The ideal entry-level account for individual users
- Instant access to 1m statistics
- Download in XLS, PDF & PNG format
- Detailed references
$69 USD $49 USD / Month *
in the first 12 months
Professional Account
Full access
Business Solutions including all features.
* Prices do not include sales tax.
Other statistics that may interest you
Professional sports
8
- Basic Statistic Most valuable sport team brands worldwide 2022
- Basic Statistic Brand value of top soccer clubs worldwide 2022
- Basic Statistic World's highest paid athletes 2021/22
- Basic Statistic Brand value of selected English Premier League clubs 2011-2022
- Basic Statistic Value of National Football League franchises 2022
- Premium Statistic Revenue of Major League Baseball teams in the U.S. 2021
- Basic Statistic Value of National Basketball Association franchises 2022
- Premium Statistic Revenue of National Hockey League franchises 2021/22
Sporting goods
7
- Premium Statistic Revenue of the sports equipment industry worldwide 2014-2027
- Premium Statistic Total revenue of the global sports apparel market 2021-2026
- Premium Statistic Size of the global sports market in 2018 and 2023, by product category
- Premium Statistic Revenue of the athletic footwear industry Worldwide 2018-2028
- Premium Statistic Sports equipment market revenue in the U.S. from 2014 to 2027, by product type
- Premium Statistic Revenue of the U.S. athletic apparel and swimwear market, by segment
- Premium Statistic Sporting goods store monthly sales in the U.S. from 2017 to 2023
Sports brands
7
- Basic Statistic Most valuable sports business companies worldwide 2019
- Premium Statistic Consumer awareness of sports brands in the U.S. 2018
- Premium Statistic Favorite sports apparel brands of consumers in the U.S. 2018
- Premium Statistic Favorite sports shoe brands of consumers in the United States as of 2018
- Premium Statistic Favorite sports equipment and gear brands of consumers in the U.S. as of 2018
- Basic Statistic Global revenue of Nike from 2016 to 2021, by product category
- Basic Statistic Adidas Group's global net sales from 2002 to 2022, by product category
Nutrition
6
- Premium Statistic Global sports nutrition & supplement market 2021-2030
- Basic Statistic Global consumer sport nutrition sales 2014-2020, by product
- Premium Statistic Global animal and plant-based protein market size 2021-2030
- Premium Statistic Sales of protein food products worldwide in 2020, by company
- Premium Statistic Size of the whey protein market worldwide 2021-2029
- Basic Statistic Protein consumption change since coronavirus outbreak in the U.S. in 2020
Sports betting
5
- Premium Statistic Key data on the global sports betting sector 2022
- Premium Statistic Brand value of leading global gambling companies 2021
- Premium Statistic Sports betting revenue in the U.S. 2018-2021
- Premium Statistic Leading websites in the sportsbook sector in the UK 2022, by share of voice
- Premium Statistic Market share of leading online sports betting operators in Italy 2023
eSports
5
- Basic Statistic Revenue of the global eSports market 2020-2025
- Basic Statistic Worldwide eSports audience size 2020
- Basic Statistic Worldwide eSports viewer numbers 2020-2025, by type
- Basic Statistic Global eSports market revenue 2021, by region
- Basic Statistic Global revenue of the eSports market 2022, by segment
COVID-19 impact
6
- Basic Statistic COVID-19: impact of canceling live sports as of March 2020
- Premium Statistic Sports industry timeframe for recovery from COVID-19 worldwide 2020
- Basic Statistic COVID-19: change in exercise habits in the U.S. April 2020
- Premium Statistic COVID-19: public opinion on going to sporting events as of April 2020
- Premium Statistic Favorite sports to watch live in the U.S. 2020
- Premium Statistic COVID-19: public support for canceling professional sports as of March 2020
Further related statistics
7
- Input capital and labor sports and recreation sector in the Netherlands 2004-2014
- Factors encouraging donations to arts, culture and sport sectors in England 2016/17
- Vacancies in the culture, sports and recreation sector in the Netherlands 2008-2021
- Recreational and cultural services: weekly UK household expenditure 2021, by income
- Government subsidies given to the cultural sectors in the Netherlands 2013-2016
- Italy: change on HICP for recreation, culture and personal care sectors 2016
- Box office of sports events in Italy 2013-2019
Further Content: You might find this interesting as well
Statistics
- Input capital and labor sports and recreation sector in the Netherlands 2004-2014
- Factors encouraging donations to arts, culture and sport sectors in England 2016/17
- Vacancies in the culture, sports and recreation sector in the Netherlands 2008-2021
- Recreational and cultural services: weekly UK household expenditure 2021, by income
- Government subsidies given to the cultural sectors in the Netherlands 2013-2016
- Italy: change on HICP for recreation, culture and personal care sectors 2016
- Box office of sports events in Italy 2013-2019
Centraal Bureau voor de Statistiek. (November 24, 2016). Total value of the capital services in the culture, sports and recreation sector in the Netherlands from 2004 to 2014 (in million euros) [Graph]. In Statista. Retrieved June 05, 2023, from https://www.statista.com/statistics/535024/value-of-capital-services-sports-and-recreation-sector-in-the-netherlands/
Centraal Bureau voor de Statistiek. "Total value of the capital services in the culture, sports and recreation sector in the Netherlands from 2004 to 2014 (in million euros)." Chart. November 24, 2016. Statista. Accessed June 05, 2023. https://www.statista.com/statistics/535024/value-of-capital-services-sports-and-recreation-sector-in-the-netherlands/
Centraal Bureau voor de Statistiek. (2016). Total value of the capital services in the culture, sports and recreation sector in the Netherlands from 2004 to 2014 (in million euros). Statista. Statista Inc.. Accessed: June 05, 2023. https://www.statista.com/statistics/535024/value-of-capital-services-sports-and-recreation-sector-in-the-netherlands/
Centraal Bureau voor de Statistiek. "Total Value of The Capital Services in The Culture, Sports and Recreation Sector in The Netherlands from 2004 to 2014 (in Million Euros)." Statista, Statista Inc., 24 Nov 2016, https://www.statista.com/statistics/535024/value-of-capital-services-sports-and-recreation-sector-in-the-netherlands/
Centraal Bureau voor de Statistiek, Total value of the capital services in the culture, sports and recreation sector in the Netherlands from 2004 to 2014 (in million euros) Statista, https://www.statista.com/statistics/535024/value-of-capital-services-sports-and-recreation-sector-in-the-netherlands/ (last visited June 05, 2023)
Total value of the capital services in the culture, sports and recreation sector in the Netherlands from 2004 to 2014 (in million euros) [Graph], Centraal Bureau voor de Statistiek, November 24, 2016. [Online]. Available: https://www.statista.com/statistics/535024/value-of-capital-services-sports-and-recreation-sector-in-the-netherlands/