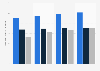
U.S. social media app time distribution 2016, by hour

Distribution of total minutes spent on selected social media apps in the United States as of January 2016

Download
Show detailed source information?
Register for free
Already a member?
Log in
Source

Use Ask Statista Research Service

Release date

January 2016

Region

United States

Survey time period

Janaury 2016

Number of respondents

9,000 respondents

Age group

18 years and older

Supplementary notes

Share of Total Minutes Spent is the % of total minutes spent on the app in the reporting month that took place in that given hour across all days
The source does not provide an exact date of survey

Citation formats
Statista Accounts: Access All Statistics. Starting from $2,388 USD / Year
Basic Account
Get to know the platform

You only have access to basic statistics.
This statistic is not included in your account.

Starter Account
The ideal entry-level account for individual users
  • Instant access to 1m statistics
  • Download in XLS, PDF & PNG format
  • Detailed references
$199 USD / Month *
Professional Account
Full access

Business Solutions including all features.

* Prices do not include sales tax.

Other statistics that may interest you

Other statistics that may interest you Statistics on

About the industry

10

About the region

10

Other regions

10

Related statistics

10

Further related statistics

2
Statista Accounts: Access All Statistics. Starting from $2,388 USD / Year
Learn more about how Statista can support your business.