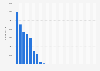
This statistic outlines the average capital expenditure of leading coal companies worldwide in 2013 and 2014. Peabody Energy Corporation, headquartered in the United States, had capital expenditures amounting to an average of 538 million U.S. dollars in 2013 and 2014.
Average capital expenditure of top coal companies worldwide in 2013 and 2014 (in million U.S. dollars)
Basic Account
Get to know the platform
You only have access to basic statistics.
This statistic is not included in your account.
Starter Account
The ideal entry-level account for individual users
- Instant access to 1m statistics
- Download in XLS, PDF & PNG format
- Detailed references
$199 USD / Month *
Professional Account
Full access
Business Solutions including all features.
* Prices do not include sales tax.
Other statistics that may interest you Statistics on
About the industry
10
- Basic Statistic Leading coal producers by emissions worldwide 1988-2013
- Premium Statistic Peabody Energy's number of employees 2005-2023
- Premium Statistic U.S. coal companies debt to EBITDA ratio 2014
- Basic Statistic Arch Coal's employment figures 2011-2022
- Basic Statistic Anthracite coal imports to the UK 2010-2022, by country
- Premium Statistic Sale prices of coal in the United States by mine type 2013-2022
- Premium Statistic Number of employees at Coal India FY 2003-2023
- Premium Statistic U.S. metallurgical coal export volume 1985-2022
- Premium Statistic Coal price per metric ton for power producers in the United Kingdom (UK) 2013-2023
- Premium Statistic Production of hard coal in the U.S. 1950-2022
About the region
10
- Basic Statistic Production expenditure of largest private oil & gas companies worldwide 2013-2014
- Premium Statistic Global coal consumption 1998-2022
- Premium Statistic Global coal reserve to production ratio by region 2020
- Premium Statistic Peabody Energy's operating profit 2009-2019
- Premium Statistic Coke production in the CIS 1993-2018
- Basic Statistic Leading open-cast coal mines worldwide based on reserve size as of 2015
- Premium Statistic Distribution of copper production worldwide 2022, by company
- Premium Statistic Market capitalization of the leading global coal companies January 2024
- Premium Statistic Peabody Energy's coal sales by region 2009-2023
- Premium Statistic Peabody coal sales 2006-2023
Selected statistics
7
- Premium Statistic Thermal coal prices 2013-2022
- Basic Statistic Global projected coal demand by region in 2017 and 2023
- Premium Statistic Coal consumption in South Africa 1998-2022
- Basic Statistic Coal consumption volume in China 1998-2022
- Premium Statistic Number of employees at Yanzhou Coal Mining 2010-2020
- Premium Statistic Poland - coal consumption in oil equivalent 2009-2022
- Premium Statistic Proved coal reserves in China, by type 2011-2020
Other regions
9
- Basic Statistic U.S. steam coal export volume 1985-2022
- Premium Statistic Canada's share of coal production by province 2021
- Basic Statistic Production of coke oven gas in the United Kingdom (UK) from 2010-2019
- Premium Statistic China's coke production 1993-2018
- Premium Statistic Coal export value share in Russia 2021, by region
- Premium Statistic Coal production in Asia Pacific 1998-2022
- Premium Statistic Japan's metallurgical coal production 1993-2018
- Premium Statistic Value of solid fuels exported from Italy 2011-2018
- Premium Statistic Delta Dunia's annual profit 2016-2022
Related statistics
10
- Premium Statistic Leading U.S. states by coal exports 2022
- Premium Statistic Sales prices of coal in U.S. states with highest production 2022
- Basic Statistic Lignite production in the U.S. 1970-2022
- Basic Statistic Coal production in the U.S. by on coalbed thickness 2022
- Basic Statistic U.S. bituminous coal export volume 1985-2022
- Basic Statistic Blast furnace gas production in the UK 2010-2019
- Premium Statistic Warrior Met Coal - sales 2016-2019
- Premium Statistic Peabody net income 2010-2022
- Basic Statistic Volume of coal sold by Arch Coal 2010-2023
- Premium Statistic Consol Energy's employment figures 2010-2023
Further related statistics
10
- Glencore's sales of energy products 2010-2023
- Devon Energy revenue 2007-2023
- Primary energy consumption in Brazil 2009-2022
- Primary energy consumption in Germany 1998-2022
- Primary energy consumption in Asia Pacific 2022
- Oil production in Venezuela 2008-2022
- Primary energy consumption change in China 2000-2022
- Oil production in Libya 1998-2022
- Primary energy consumption in South Korea 2021-2022, by fuel
- OPEC's crude oil production 1998-2022
Further Content: You might find this interesting as well
Statistics
- Glencore's sales of energy products 2010-2023
- Devon Energy revenue 2007-2023
- Primary energy consumption in Brazil 2009-2022
- Primary energy consumption in Germany 1998-2022
- Primary energy consumption in Asia Pacific 2022
- Oil production in Venezuela 2008-2022
- Primary energy consumption change in China 2000-2022
- Oil production in Libya 1998-2022
- Primary energy consumption in South Korea 2021-2022, by fuel
- OPEC's crude oil production 1998-2022
ODI, & Oil Change International. (November 11, 2015). Average capital expenditure of top coal companies worldwide in 2013 and 2014 (in million U.S. dollars) [Graph]. In Statista. Retrieved April 19, 2024, from https://www.statista.com/statistics/545909/average-capex-of-leading-coal-companies-worldwide/
ODI, und Oil Change International. "Average capital expenditure of top coal companies worldwide in 2013 and 2014 (in million U.S. dollars)." Chart. November 11, 2015. Statista. Accessed April 19, 2024. https://www.statista.com/statistics/545909/average-capex-of-leading-coal-companies-worldwide/
ODI, Oil Change International. (2015). Average capital expenditure of top coal companies worldwide in 2013 and 2014 (in million U.S. dollars). Statista. Statista Inc.. Accessed: April 19, 2024. https://www.statista.com/statistics/545909/average-capex-of-leading-coal-companies-worldwide/
ODI, and Oil Change International. "Average Capital Expenditure of Top Coal Companies Worldwide in 2013 and 2014 (in Million U.S. Dollars)." Statista, Statista Inc., 11 Nov 2015, https://www.statista.com/statistics/545909/average-capex-of-leading-coal-companies-worldwide/
ODI & Oil Change International, Average capital expenditure of top coal companies worldwide in 2013 and 2014 (in million U.S. dollars) Statista, https://www.statista.com/statistics/545909/average-capex-of-leading-coal-companies-worldwide/ (last visited April 19, 2024)
Average capital expenditure of top coal companies worldwide in 2013 and 2014 (in million U.S. dollars) [Graph], ODI, & Oil Change International, November 11, 2015. [Online]. Available: https://www.statista.com/statistics/545909/average-capex-of-leading-coal-companies-worldwide/