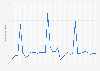
Apparent steel use per capita in the Czech Republic 2009-2021
In 2021, apparent steel use in the Czech Republic had reached 743 kilograms of finished steel products per capita, almost a 27 percent increase from the previous year. From 2009 to 2011, steel use per capita rose from 430 kilograms of finished steel products used to 574 kilograms used. Despite dropping in 2012 and 2013, there is an overall trend of growth during these ten years. The Czech Republic's apparent steel consumption per capita decreased again in the following two years.