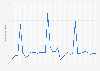
This statistic illustrates the production of continuously-cast steel in Croatia from 2006 to 2015, in thousand metric tons. Continuous casting refers to the process whereby molten steel is solidified into a not completely finished billet, bloom or slab for further processing in the finishing mills. The production of continuously-casted steel in Croatia increased from 2009 to 2015 by approximately 284 percent.
Annual production of continuously-cast steel in Croatia from 2006 to 2015* (in 1,000 metric tons)
Basic Account
Get to know the platform
You only have access to basic statistics.
This statistic is not included in your account.
Starter Account
The ideal entry-level account for individual users
- Instant access to 1m statistics
- Download in XLS, PDF & PNG format
- Detailed references
$199 USD / Month *
Professional Account
Full access
Business Solutions including all features.
* Prices do not include sales tax.
Other statistics that may interest you Statistics on
About the industry
10
- Premium Statistic Poland: continuously-cast steel annual production 2006-2022
- Premium Statistic Slovakia: continuously-cast steel annual production 2006-2021
- Premium Statistic Sweden: continuously-cast steel annual production 2006-2021
- Premium Statistic EU-27: continuously-cast steel annual production 2006-2022
- Premium Statistic Austria: continuously-cast steel annual production 2006-2021
- Premium Statistic Czech Republic: continuously-cast steel annual production 2006-2021
- Premium Statistic Netherlands: continuously-cast steel annual production 2006-2021
- Premium Statistic Portugal: continuously-cast steel annual production 2006-2021
- Premium Statistic Romania: continuously-cast steel annual production 2006-2021
- Premium Statistic Italy: continuously-cast steel annual production 2006-2021
About the region
9
- Basic Statistic Production value of the information & communication industry in Croatia 2012-2021
- Basic Statistic Mining and quarrying sector: production value in Croatia 2012-2021
- Basic Statistic Textile manufacturing sector: production value in Croatia 2012-2021
- Premium Statistic Croatia: total production of crude steel from 2009-2021
- Premium Statistic Secondary aluminum production in Croatia 2009-2019
- Premium Statistic Primary aluminum consumption in Croatia 2009-2018
- Basic Statistic Croatia: monthly inflation rate in 2018
- Basic Statistic Croatia: consumer opinions on economic situation over the last 12 months in 2017-2018
- Basic Statistic Croatia: monthly financial situation of consumers over the last 12 months in 2017-18
Selected statistics
3
Other regions
10
- Premium Statistic Global steel industry - Nucor Corporation's revenue 2006-2022
- Premium Statistic Ferroalloys demand volume in Japan 2013-2022
- Premium Statistic Greece: total production of crude steel from 2009-2021
- Premium Statistic Latvia: total production of crude steel from 2009 to 2013
- Premium Statistic Iron and steel industry in the United States - employment 2013-2019
- Premium Statistic Mexico: major metal and steel companies 2019, by revenue
- Premium Statistic Billet steel production in Taiwan 2008-2019
- Premium Statistic Apparent steel use per capita in Finland 2008-2019
- Premium Statistic Spain: total production of crude steel from 2009 to 2021
- Premium Statistic Czech Republic: total production of crude steel 2009-2021
Related statistics
10
- Premium Statistic Maanshan Steel total assets in China 2015-2020
- Premium Statistic Maanshan Steel net profit in China 2015-2020
- Premium Statistic Total assets of HBIS Group in China 2014-2019
- Premium Statistic Pre-tax profit of HBIS Group in China 2014-2019
- Premium Statistic Number of employees for HBIS Group in China 2014-2019
- Premium Statistic Revenue of Chinese steelmaker Jianlong Group 2015-2019
- Premium Statistic Profit before tax of Chinese steelmaker Jianlong Group 2016-2019
- Premium Statistic Valin Steel total assets in China 2015-2019
- Premium Statistic Valin Steel net profit in China 2015-2019
- Premium Statistic Valin Steel revenue in China 2015-2019
Further related statistics
10
- Number of Rio Tinto's employees 2010-2023
- Rio Tinto's aluminum and copper production 2010-2023
- Grape crush volume share in California for the production of wine 2022, by variety
- Amount of grapes crushed in California for wine production 2000-2022, by wine variety
- Comparison of cobalt consumption in the U.S. 2010-2023
- Iron ore prices 2000-2022
- Thermal coal prices 2013-2022
- UEFA European Championship commercial revenue 1992-2021
- China: computer production 2008-2010
- Rare earths demand growth rates for specific industry sectors 2010-2015
Further Content: You might find this interesting as well
Statistics
- Number of Rio Tinto's employees 2010-2023
- Rio Tinto's aluminum and copper production 2010-2023
- Grape crush volume share in California for the production of wine 2022, by variety
- Amount of grapes crushed in California for wine production 2000-2022, by wine variety
- Comparison of cobalt consumption in the U.S. 2010-2023
- Iron ore prices 2000-2022
- Thermal coal prices 2013-2022
- UEFA European Championship commercial revenue 1992-2021
- China: computer production 2008-2010
- Rare earths demand growth rates for specific industry sectors 2010-2015
World Steel Association. (November 15, 2017). Annual production of continuously-cast steel in Croatia from 2006 to 2015* (in 1,000 metric tons) [Graph]. In Statista. Retrieved April 24, 2024, from https://www.statista.com/statistics/555902/annual-production-continuously-cast-steel-croatia/
World Steel Association. "Annual production of continuously-cast steel in Croatia from 2006 to 2015* (in 1,000 metric tons)." Chart. November 15, 2017. Statista. Accessed April 24, 2024. https://www.statista.com/statistics/555902/annual-production-continuously-cast-steel-croatia/
World Steel Association. (2017). Annual production of continuously-cast steel in Croatia from 2006 to 2015* (in 1,000 metric tons). Statista. Statista Inc.. Accessed: April 24, 2024. https://www.statista.com/statistics/555902/annual-production-continuously-cast-steel-croatia/
World Steel Association. "Annual Production of Continuously-cast Steel in Croatia from 2006 to 2015* (in 1,000 Metric Tons)." Statista, Statista Inc., 15 Nov 2017, https://www.statista.com/statistics/555902/annual-production-continuously-cast-steel-croatia/
World Steel Association, Annual production of continuously-cast steel in Croatia from 2006 to 2015* (in 1,000 metric tons) Statista, https://www.statista.com/statistics/555902/annual-production-continuously-cast-steel-croatia/ (last visited April 24, 2024)
Annual production of continuously-cast steel in Croatia from 2006 to 2015* (in 1,000 metric tons) [Graph], World Steel Association, November 15, 2017. [Online]. Available: https://www.statista.com/statistics/555902/annual-production-continuously-cast-steel-croatia/